How to Use Biodiversity Equations to Compare Biodiversity (Shannon Index)
3 min read•july 11, 2024
Cody Williams
AP Environmental Science ♻️
252 resourcesSee Units
The Shannon Biodiversity Index
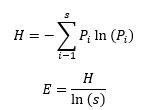
The Shannon Biodiversity Index is one way to use math to compare the biodiversity 🐸 in two locations. The Shannon Biodiversity Index equation is as follows:

When using this equation, you are trying to solve for E. When E = 1, the species in a population are equally represented which means the population has biodiversity.
Want to learn more about biodiversity make sure you watch this 🎥 video on Biodiversity and Ecosystem Services for more info!
Variables to Know
This equation uses a lot of variables and looks very intimidating 😨 at first, but if you just take it step-by-step, it won't be hard 😎 . Here is what all the variables represent.
- Pi 🥧 - Pi represents the number of a certain species divided by the total population. The 'i' in Pi for this equation represents the species you are calculating Pi for.
- S - The variable 's' represents the number of species in a population.
- E - The variable 'E' represents the evenness of species in a population. The fact that different species are represented evenly is an important factor of biodiversity.
- H - The variable 'H' is the Shannon Biodiversity Index number. Higher values of H represent greater biodiversity.
How to Use the Equation
I feel the best way to explain this equation is through an example. Below is an example of a population and how we would use the Shannon Index to calculate the biodiversity or species evenness.
Example Population:
- Rattlesnakes 🐍 : 18
- Whitetail Deer 🦌 : 25
- Bald Eagle 🦅 : 15
- Lizards 🦎 : 22
- Bears 🐻 : 11
- Bobcat 🐈 : 19
- Total Population: 110
1. The first step is to calculate the value of Pi 🥧 for each species. When using this equation, I typically round to the hundredths 💯 , but your teacher might say otherwise. It is still the same thing though. All the values of Pi you calculate added together should equal 1 or close to one (i.e. .98 or .99).

2. Next, we need to calculate the natural log, or ln, of Pi 🥧 for each value. Remember to watch rounding!

3. Now, we are going to multiply the Pi 🥧 value to its natural log value.

4. After that, we add Pi * ln (Pi) values and multiply them by -1 to get H.

5. At the top of the page, we saw two equations. The four previous steps worked out the first equation to find H. Now, we are going to use H to find E.

That's the entire equation. ❗Remember, don't stop at the H value❗ That is a big mistake. Our E value for this example was 0.98. This is very close to 1 which means the species were evenly represented in the population and the biodiversity is good.
Using the Values to Compare
You can use this E value to compare the species evenness of this population to another. Let's say we used the same equation on another population, population 2. If their E value was .56, that would tell us that population 1 has a greater species evenness, because the species in population 1 were more equally represented.
In this equation, the higher the H value, the greater the diversity in a population. In population 1, the H value was 1.76. For example, if another population had an H value of 1.09, it would have less biodiversity in the community than our original population.
Continue to learn about biodiversity and population by reading about the impacts humans have on biodiversity!
Browse Study Guides By Unit
🏜Unit 1 – The Living World: Ecosystems
🐠Unit 2 – The Living World: Biodiversity
👪Unit 3 – Populations
🌏Unit 4 – Earth Systems & Resources
🏖Unit 5 – Land & Water Use
⚡️Unit 6 – Energy Resources & Consumption
💨Unit 7 – Atmospheric Pollution
♻️Unit 8 – Aquatic & Terrestrial Pollution
🔥Unit 9 – Global Change
📚Study Tools
🤔Exam Skills

Fiveable
Resources
© 2025 Fiveable Inc. All rights reserved.