6.4 The Effects of Government Intervention in Different Market Structures
4 min read•june 18, 2024
J
Jeanne Stansak
dylan_black_2025
AP Microeconomics 🤑
95 resourcesSee Units
Introduction
In the last few sections, we've talked about types of market failure, situations in which the unregulated market fails to produce where MSB = MSC. We've relatively loosely thrown around the idea that the government can take action in markets, but we haven't looked super closely into how the government actually does so (outside of our short discussion of Pigouvian taxes and subsidies). This guide will look at two main tools of government intervention in markets: taxes/subsidies and price controls, specifically in relation to regulating a monopoly.
Effects of Per-Unit and Lump Sum Taxes on Cost Curves
The main action of the government is to either tax firms, forcing them to give money to the government, or subsidize firms, giving them money. We talked about excise taxes on markets back in unit 2, but haven't looked deep into how per-unit and lump sum taxes impact the firm.
Per-Unit vs. Lump Sum Taxes
First, let's break down the difference between a per-unit tax and a lump sum tax. A per-unit tax is exactly what it sounds like: a smaller tax on every unit produced. For example, suppose for every laptop produced by Apple, $2 had to go to the government. This is a per-unit tax. By contrast, a lump sum tax is a one time fixed tax. For example, if the government taxed Apple a flat $500.
This is an important distinction because this means a lump sum tax is in essence a fixed cost, whereas a per-unit tax impacts marginal cost.
Graphing Taxes in the Firm
This guide will focus on graphing taxes since that's most common, but graphing a subsidy is the exact same just in the opposite direction. We'll also assume a perfectly competitive market for simplicity, but the same applies for a Monopoly/Monopolistic Competition since MC and ATC are the same in either market.
Per-Unit Taxes
A per-unit tax is in essence an addition to marginal cost, since it is an additional cost on every additional unit. For example, if producing every additional unit was $3 and we applied a $1 per unit tax, marginal cost is now 4. The original 3 plus the tax of 1. Thus, marginal cost will shift up with a per-unit tax. Along with marginal cost, ATC will shift up as well. This is because a per-unit tax impacts variable costs and thus ATC.
This is visualized in the graph below:
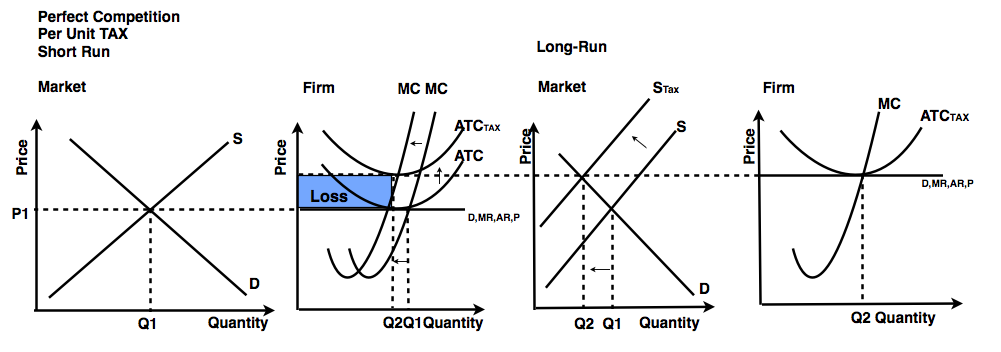
In this graph, we see the shift left of MC and the shift up of ATC, leading to a loss in the market. We also see a reminder of the long-run adjustment that would happen with a perfectly competitive market.
Lump Sum Taxes
Unlike a per-unit tax, a lump sum tax does not affect marginal cost. This is because it is a one time fixed tax. This means it shifts AFC and ATC up (but we usually don't draw AFC, so just ATC in most cases). Once again, this graph shows us the long-run adjustment as well:

Regulating a Monopoly
A monopoly, as mentioned in Unit 4, is a market where the most efficient number of firms in the industry is only one. Here's the graph for a monopoly:
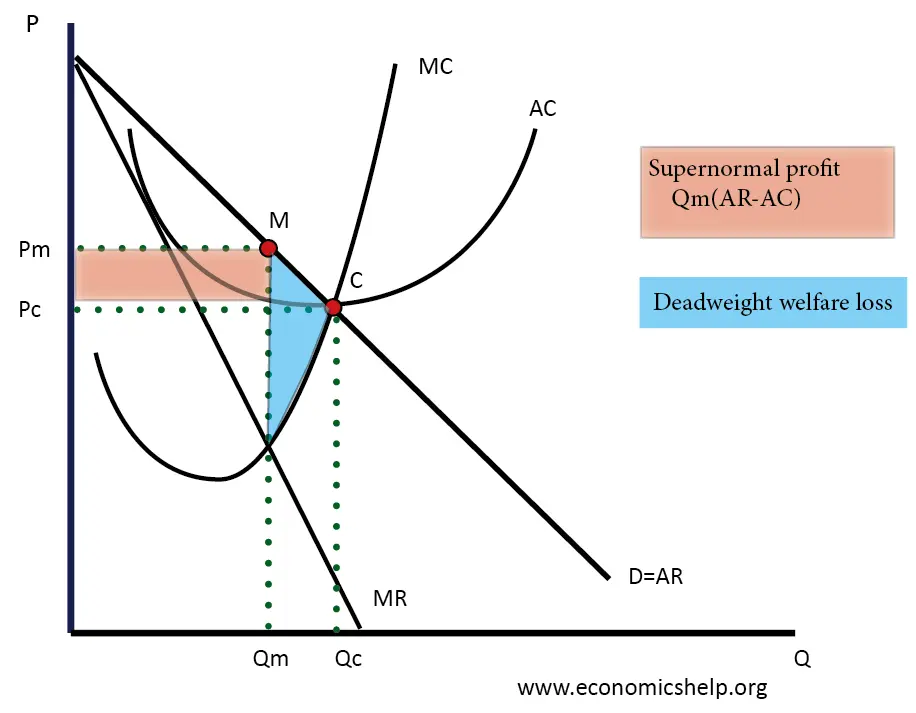
Point M is where a monopoly would produce when they are unregulated by the government. At this point, we have a pretty large area of deadweight loss, meaning we have some degree of market failure, where we are not allocating resources to the point where P = MC.
We have a few different places we can regulate a monopoly to avoid this. In particular, the socially optimal point and the fair-return point.
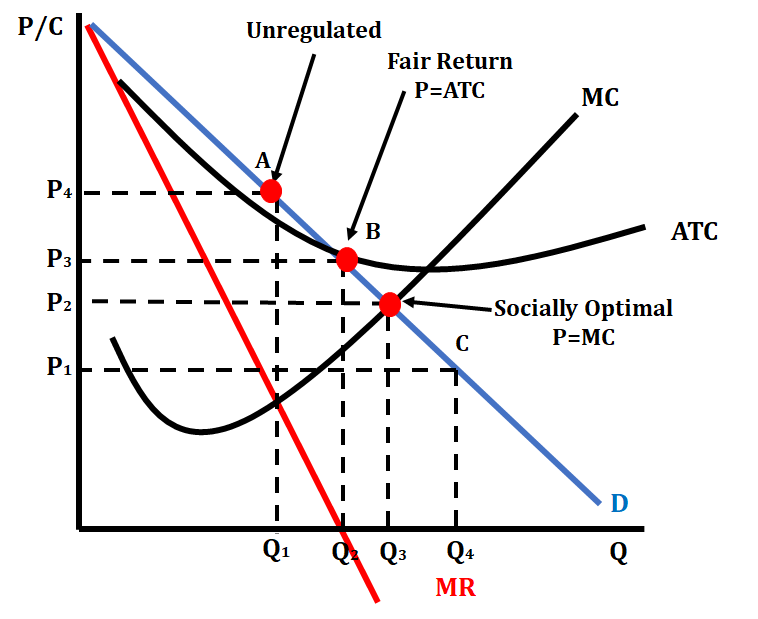
The most obvious approach is to set a price ceiling at P2 in the above graph to force the monopoly to produce at P2 and Q3, the socially optimal price and quantity. However, there's a problem: the firm's making a loss! The monopoly will need a lump-sum subsidy to produce here. This will cause ATC to shift down to the point where the firm will break even at the socially optimal point.
Another option is to simply compromise with the monopoly and let it produce where they break even, at point B in the above graph. At this point, P3 and Q2, the firm makes zero profit, but the government also doesn't have to subsidize the firm. There is a small amount of deadweight loss (see if you can spot it!), but much less than before.
Browse Study Guides By Unit
💸Unit 1 – Basic Economic Concepts
📈Unit 2 – Supply & Demand
🏋🏼♀️Unit 3 – Production, Cost, & the Perfect Competition Model
⛹🏼♀️Unit 4 – Imperfect Competition
💰Unit 5 – Factor Markets
🏛Unit 6 – Market Failure & the Role of Government
🤔Exam Skills
📚Study Tools
Fiveable
Resources
© 2025 Fiveable Inc. All rights reserved.