2.3 Extracting Information from Data
5 min read•june 18, 2024
Minna Chow
Milo Chang
AP Computer Science Principles ⌨️
80 resourcesSee Units
One of the neat things about data is that we can get information from it! By examining it closely, we can identify trends, make connections and address problems. This is true in almost every field, from science to history.
One or a few data points may not be enough to create a coherent conclusion—you could be dealing with an outlier, and it's difficult to see trends. With larger data sets (often very large data sets, known as big data), you can establish more comprehensive patterns. However, it is important to note that correlation does not necessarily indicate that a casual relationship exists. A correlation just suggests areas for additional research to understand the exact nature of the relationship between
As the world gets bigger and more interconnected, a vast amount of data becomes more accessible and needs to be tracked.
🔗 Take a look at this visual of global shipping in the year 2012!
To create this graphic, researchers had to track millions of shipments over months. This is just one example of the rapidly-growing need for big data processing.
As the data sets get larger and larger, computers become a necessary tool to help us process it. They can process data faster and with less error than humans. (Imagine sorting through all of that shipping data by hand...). At larger scales, you may even need multiple computers or parallel systems to process all the data involved.
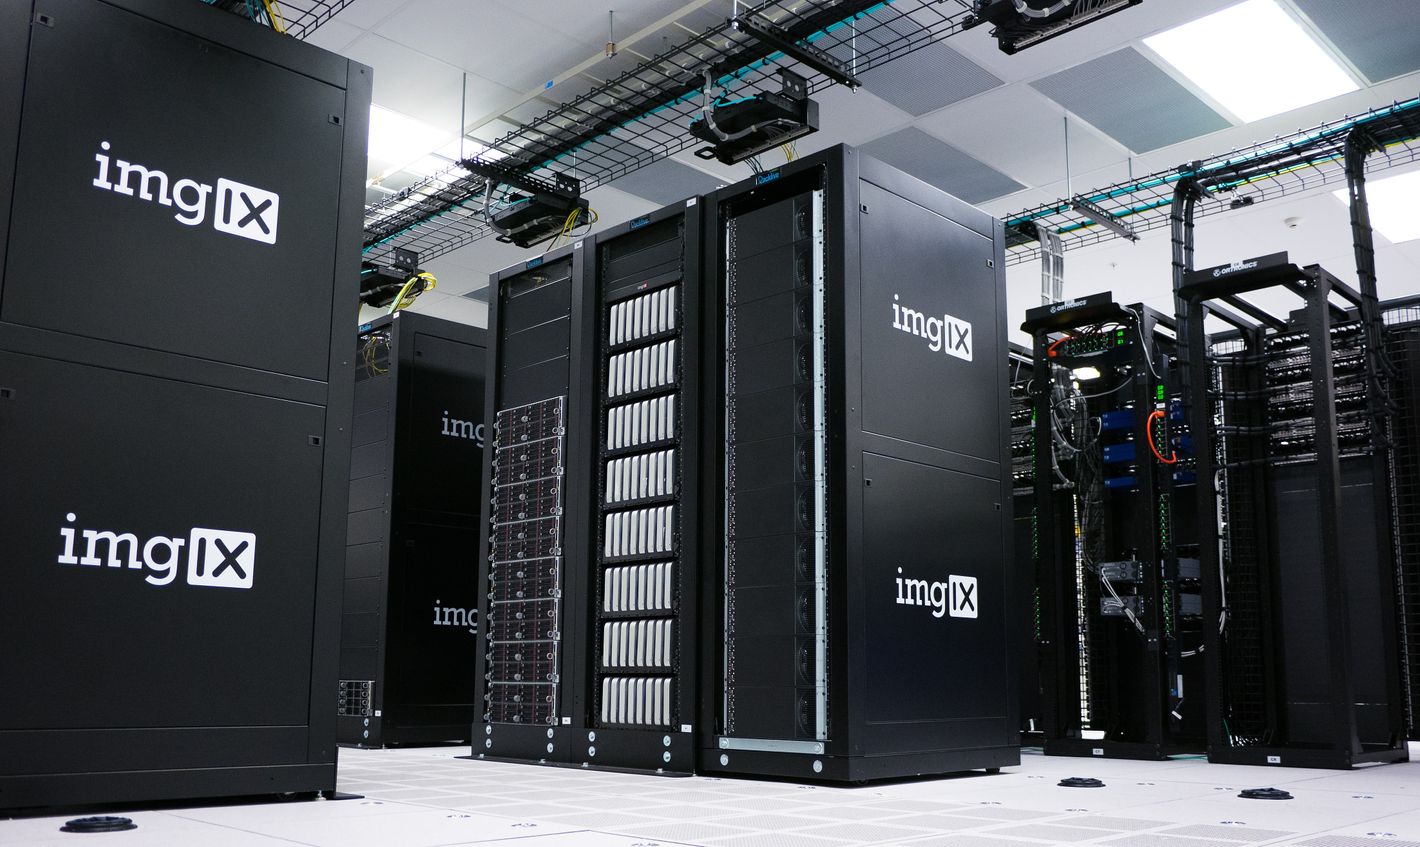
This demand has even led to the creation of server farms, areas where many large computers are housed for the purpose of meeting intense processing needs such as dealing with big data sets. Server farms are often located in large data centers, but they can also be stored in much smaller rooms as well.

Servers in a data farm. Image source: imgix on Unsplash
When you're working with data sets in a system, you need to consider how scalable the system is. Scalability is the ability of a resource to adapt as the scale of the data it uses increases (or decreases). Although a scalable resource might require, for example, more servers or access points, it won't have to change the basics of how it operates. The more scalable a system is, the more data you can process and store within it.
In terms of data processing, you're only as good as the tools you have to work with. The more powerful your computer is, the better the data processing you'll be able to do.
One of the ways to make processing data easier is through the use of metadata.
Metadata
Metadata is data about data.
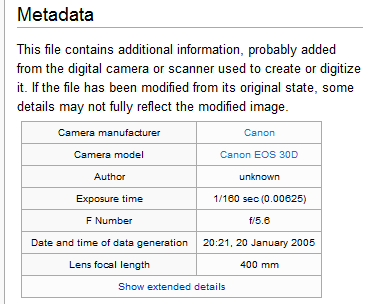
It's like the packing label on a box in the mail or the tags on a piece of clothing: it gives you information about the item it's attached to. For example, the metadata for a YouTube video could include the title, creator, description, and tags for the video, as well as when it was uploaded and how large it is.

Image source: Editor at Large / Public domain
If you change or delete the metadata, it doesn't affect the data itself. For example, if you change the description of a video, you don't affect the video itself.
Metadata is used to help find and organize data: you can use it to sort and group it. It can also provide additional information to help you use your data more effectively. For example, metadata that tells you when a video was uploaded or a post was made can help you decide whether or not the information you're looking at is outdated.
Problems Collecting and Processing Data
Regardless of how large they are, data sets can be challenging to deal with. Fortunately, computers can help us deal with some of these issues.
For example, data may not be uniform due to its collection process.
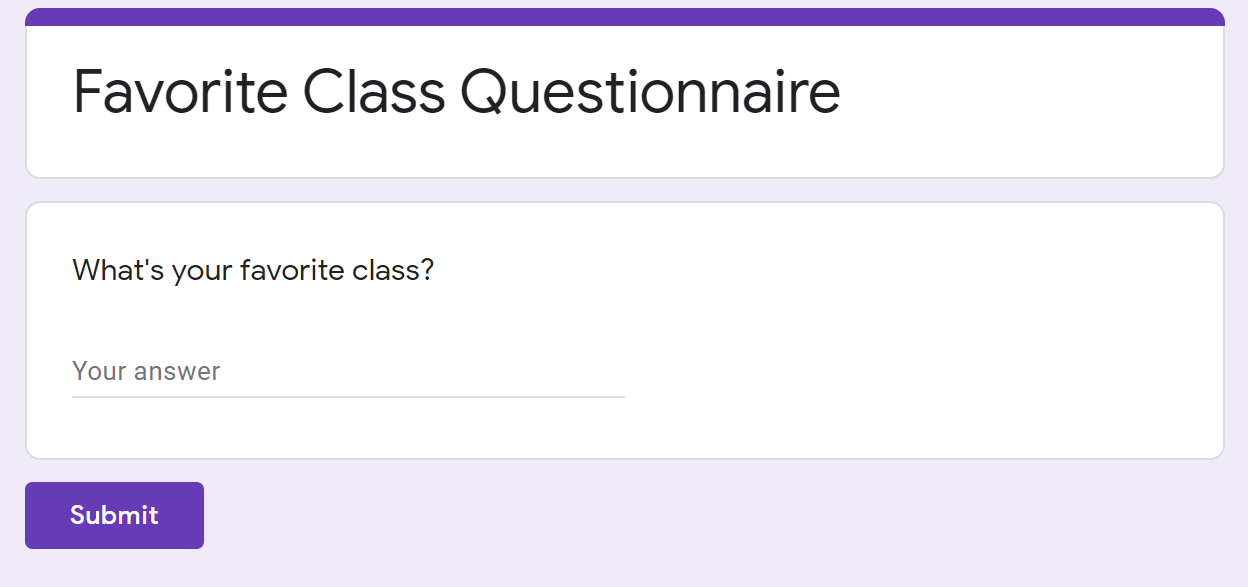
Imagine you made a Google Survey to find out what class people like the most at your school. You create a form that looks like this:

Image source: Google Surveys
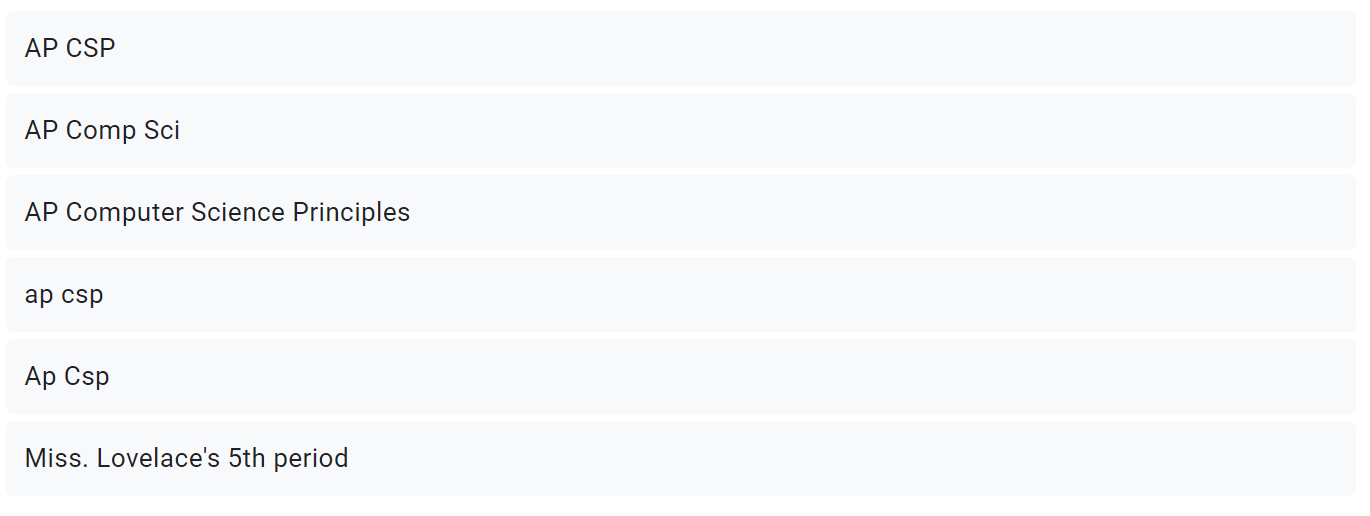
Looking at the results, you see that a lot of people say AP Computer Science Principles is their favorite class! However, they don't all choose to say it the same way.

Image source: Google Surveys
...the list goes on. This lack of uniformity could make it very difficult to work with your data, especially if you're potentially looking at hundreds of entries.
You might also run into this uniformity issue if you're compiling data from many different resources, where formatting standards may be a little different. For example, let's say you're working with a friend to track what time of day people find the most productive, but you're writing down results using 12 hour time while they're using 24 hour time. (Probably just to be difficult.)
The way that computers deal with this is through a process known as cleaning data. This process makes data uniform by eliminating all of these differences. Cleaning data can also help flag or remove invalid and incomplete data.
Data Biases
Data sets may be biased for a variety of reasons.
Taking the favorite class questionnaire as an example, there are many ways in which bias could sneak in:
- People have to take the initiative to fill out this form, which means they're more likely to have strong opinions about the topic when compared to the rest of the population. People who don't really have a favorite class or don't care about school in general won't be all that represented in the study, skewing results for your school overall.
- This survey just looks at one school, which could also bias results. Your AP Comp Sci teacher might just be a really good teacher, for example, so people might like the class for the teacher rather than the subject.
- The context of your survey might also impact results. The results you get if you post this survey in your AP Comp Sci class could be completely different from the results you'd get if you posted it in a Basketball group chat.
- Data can also be biased on societal lines such as race and gender.
Just collecting more data won't make this problem go away by itself; you need to identify potential biases in your data and take steps to correct them, such as surveying people from different schools or classes.
Browse Study Guides By Unit
🕹Unit 1 – Creative Development
⚙️Unit 2 – Data
📱Unit 3 – Algorithms & Programming
🖥Unit 4 – Computer Systems & Networks
⌨️Unit 5 – Impact of Computing
🧐Exam Skills

Fiveable
Resources
© 2025 Fiveable Inc. All rights reserved.