J
Jeanne Stansak
dylan_black_2025
AP Macroeconomics 💶
99 resourcesSee Units
Problems With Nominal Variables
So far, we've calculated GDP, but we haven't looked at how price changes factor into our interpretation of GDP. The raw number of GDP, not adjusted for prices, is called nominal GDP. For example, let's say one year, GDP was $100, and the next, $200. This could mean one of two things: either production doubled, or prices doubled. If prices doubled, then the economy didn't actually get any better, prices just rose. This main problem means we can't accurately compare nominal GDPs, since we don't know how prices changed. Thus, we adjust by calculating real GDP.
Nominal vs. Real GDP
Nominal Gross Domestic Product (GDP) is the total market value of all goods and services produced in an economy in a given year, calculated using current market prices. It is typically used as a measure of economic growth and is often used to compare economic performance over time.
As discussed, nominal GDP does not take into account the impact of inflation on the economy. Inflation is the general increase in the price of goods and services over time, which can lead to a decline in the purchasing power of money. As a result, nominal GDP may not accurately reflect the true growth of an economy, as it does not consider the effect of inflation on the value of goods and services.
Real Gross Domestic Product (rGDP) is a measure of economic growth that adjusts for the impact of inflation. It is calculated by adjusting nominal GDP for the effects of inflation, using a base year as a reference point. This allows for a more accurate comparison of economic performance over time, as it takes into account changes in the purchasing power of money.
How to Calculate Real and Nominal GDP
Steps to Calculate both Nominal GDP and Real GDP
- Real GDP: Multiply the amount of each good produced by the base year prices (i.e in this case the base year is 2018)
- Nominal GDP: Multiply the amount of each good produced by the price in that particular year.
EXAMPLE #1
United States GDP Data for 2018

United States GDP Data for 2019

2018 Nominal GDP = Steel Production ($4,000,000) + Wheat Production ($600,000) + Corn Production ($600,000) + Sugar Production ($100,000) = $5,300,000
2019 Nominal GDP = Steel Production ($5,500,000) + Wheat Product ($900,000) + Corn Production ($1,200,000) + Sugar Production (400,000) = $8,000,000
Real GDP for 2019 = Steel Production (550,000 x $8) + Wheat Production (300,000 x $3) + Corn Production (400,000 x $2) + Sugar Production (200,000 x $1) = $6,300,000
EXAMPLE #2
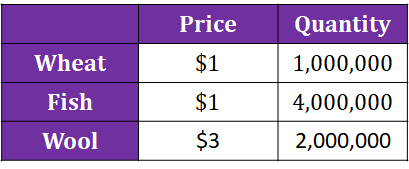
Germany GDP Data for 2017

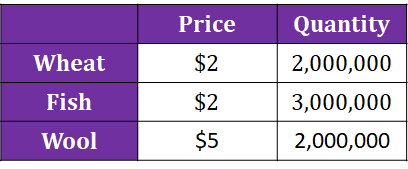
Germany GDP Data for 2018

2017 Nominal GDP = Iron Production ($1,500,000) + Coal Production ($2,000,000) + Wheat Production ($500,000) + Granite Production ($1,500,000) = $5,500,000
2018 Nominal GDP = Iron Production ($1,500,000) + Coal Production ($3,500,000) + Wheat Production ($900,000) + Granite Production ($2,000,000) = $7,900,000
Real GDP for 2018 = Iron Production (100,000 x $10) + Coal Production (500,000 x $4) + Wheat Production (300,000 x $2) + Granite Production (100,000 x $15) = $5,100,000
Using the GDP Deflator
This is another index that is used to measure the effects of inflation. Instead of comparing two market baskets, it compares the nominal and real GDP of a country in a year. When nominal GDP = real GDP (ie. there is zero inflation), the GDP deflator is 100. It is called the GDP deflator because it is used to "deflate" nominal GDP, which may be overstated because of high prices.
The formula is:
GDP Deflator = (Nominal GDP / Real GDP) * 100
This formula can also be rearranged to solve for nominal or real GDP:
Nominal GDP = Real GDP * (GDP Deflator / 100)
Real GDP = Nominal GDP / (GDP Deflator / 100)
EXAMPLE #1
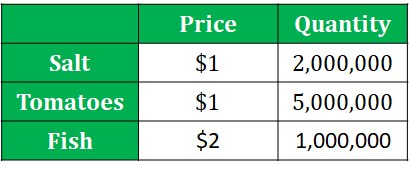
Great Britain GDP Data for 2017:

2017 Nominal GDP = $11,000,000
Since 2017 is the base year, the nominal GDP and real GDP are the same. When calculating the GDP Deflator for the base year you will find that it is always equal to 100.
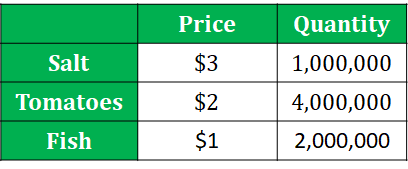
Great Britain GDP Data for 2018:

2018 Nominal GDP = 20,000,000
2018 Real GDP = 11,000,000
GDP Deflator for 2018 is 181
2018 Inflation Rate is 81%
EXAMPLE #2
Italy GDP Data for 2017:

2017 Nominal GDP = $9,000,000
Since 2017 is the base year, the nominal GDP and real GDP are the same. When calculating the GDP Deflator for the base year you will find that it is always equal to 100.
Italy GDP Data for 2018:

2018 Nominal GDP = 13,000,000
2018 Real GDP = 9,000,000
GDP Deflator for 2018 is 144
2018 Inflation Rate is 44%
Browse Study Guides By Unit
💸Unit 1 – Basic Economic Concepts
📈Unit 2 – Economic Indicators & the Business Cycle
💲Unit 3 – National Income & Price Determination
💰Unit 4 – Financial Sector
⚖️Unit 5 – Long-Run Consequences of Stabilization Policies
🏗Unit 6 – Open Economy - International Trade & Finance
🤔Exam Skills
📚Study Tools

Fiveable
Resources
© 2025 Fiveable Inc. All rights reserved.