J
Jeanne Stansak
AP Macroeconomics 💶
99 resourcesSee Units
Vocabulary
Consumer Price Index—a measure that examines the weighted average of prices of a basket of consumer goods and services, such as transportation, food, and medical care. (Source: investopedia.com). The basket of consumer goods that we are talking about is a sample of goods and services that are typically bought by your average household.
Inflation—the general rising of prices in a market or aggregate economy over time.
Deflation—the general decrease of prices in a market or aggregate economy over time.
Disinflation—a decrease in the rate of inflation
Inflation Rate—the percent change in aggregate price level across an entire economy in one year.
Real variables—variables where the effects of inflation have been factored out.
Defining Inflation
So far, we've looked at GDP, which shows production, and unemployment, which describes the labor force. Inflation is another important economic concept that measures the general level of prices in an economy over time. Inflation is usually measured by the percentage change in a price index, such as the Consumer Price Index (CPI) or the GDP deflator.
Inflation occurs when the general level of prices in an economy is rising. It is expressed as a percentage and represents the rate at which the general price level is increasing over time. For example, if the inflation rate is 3%, it means that the general level of prices in the economy is increasing at a rate of 3% per year.
Deflation is the opposite of inflation and occurs when the general level of prices in an economy is falling. Deflation is expressed as a negative percentage and represents the rate at which the general price level is decreasing over time.
Disinflation is a slower rate of inflation, or a slowing down of the rate at which the general price level is increasing. For example, if the inflation rate was previously 5% and it slows down to 3%, it would be considered disinflation.
Inflation, deflation, and disinflation are all important economic concepts that can have significant impacts on an economy. Inflation can affect the purchasing power of money, as prices for goods and services rise faster than wages or incomes. Deflation can also have negative effects, as it can lead to a decline in demand and a decrease in economic activity. Central banks and governments typically aim to keep inflation within a certain range, as too high or too low of an inflation rate can have negative impacts on the economy. For the United States, this is roughly 2%. We'll talk about how the government and economic policy-makers target these variables later in the course - get excited!
Here's a graph of what the inflation rate has been throughout the latter half of the 20th century. Note that in general, recessionary periods bring with it lower inflation. The exception to this is the recession in the 1970s. This is because the economy experienced stagflation, in which prices rose and the economy contracted. This was because of oil crises.
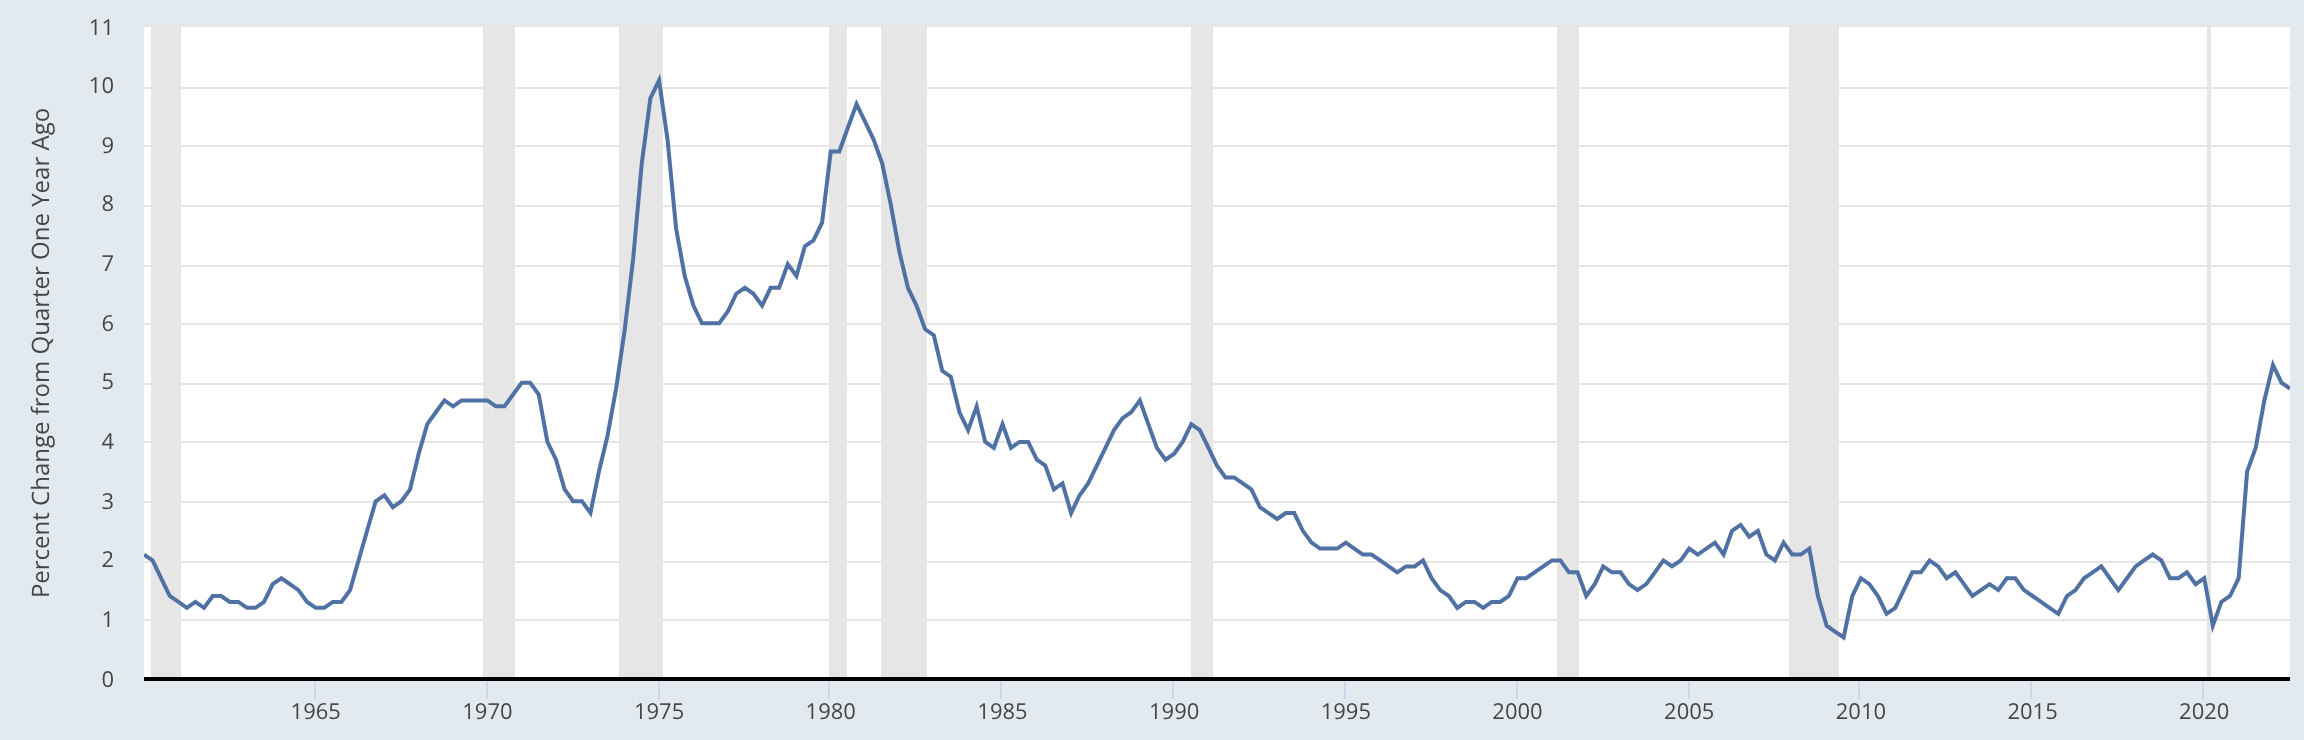
The Inflation Rate in the United States over time. Source: FRED (Federal Reserve Economic Data)
Price Indices and the CPI
A price index is a statistical measure that reflects the changes in the general level of prices for a basket of goods and services over time. Price indices are commonly used to measure inflation and deflation, as they provide a way to track changes in the general price level of an economy.
One common price index is the Consumer Price Index (CPI), which measures the changes in the prices of a basket of goods and services consumed by households. The CPI is calculated by the Bureau of Labor Statistics in the United States and is used to measure the changes in the cost of living over time.
The CPI is based on a market basket of goods and services that is representative of the purchases made by households. The market basket includes a wide range of goods and services, including food, housing, clothing, transportation, and medical care. The prices of these goods and services are collected and used to calculate the CPI.
To calculate the CPI, the Bureau of Labor Statistics collects price data for the goods and services in the market basket from a sample of retailers, service providers, and other sources. These prices are then used to calculate the cost of the market basket at a specific point in time, known as the base period. The CPI is then calculated by comparing the cost of the market basket in the current period to the cost of the market basket in the base period, and expressing the change as a percentage.
The CPI is used to measure the changes in the cost of living over time and is often used to adjust wages, Social Security payments, and other income for inflation. It is also used to make international comparisons of inflation rates and to inform policy decisions related to monetary policy.
One source of bias in the CPI is the substitution bias, which occurs when consumers switch to cheaper alternatives as the prices of certain goods and services rise. If the CPI does not take into account these substitutions, it may overstate the actual increase in the cost of living.
Practice Problems
How to Calculate the CPI
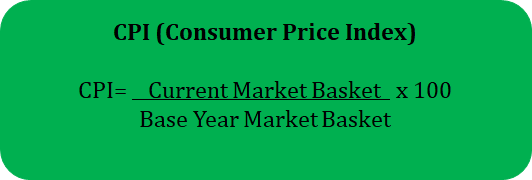
The CPI defines a base year in which all other index values are based on. At the base year, the value is 100, and all other numbers represent a percent increase or decrease from the base year. For example, a CPI of 110 implies that prices have risen 10% since the base year. To find the CPI for a given year, divide that market basket by the base year and multiply by 100 convert to a percent.
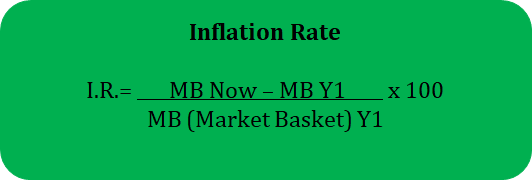
To calculate the inflation rate, just calculate the percent change in prices or in CPIs. Percent change is defined as (final - initial) / initial * 100.
Formulas
Sample Problem
United States Market Basket - 2016

United States Market Basket - 2017
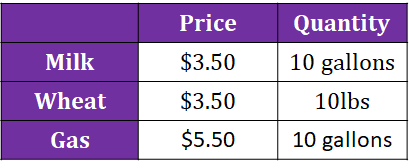
United States Market Basket - 2018
The first step in calculating either the CPI or the inflation rate is to figure out the value of each market basket. Once you have calculated the market basket, then you can figure out both the CPI for each year and the inflation rate from year to year.
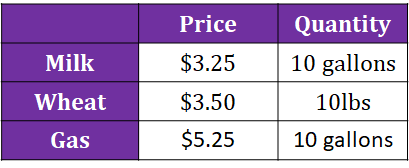
To find the value of the market basket for each year, you simply multiply Price x Quantity for each good and then add all those amounts together. Let's use 2016 as the base year in this example.
Market Basket Value for 2016 = ($3 x 10) + ($2 x 10) + ($5 x 10) = $100
Market Basket Value for 2017 = ($3.25 x 10) + ($3.50 x 10) + ($5.25 x 10) = $120
Market Basket Value for 2018 = ($3.50 x 10) + (3.50 x 10) + (5.50 x 10) = $125
💡When calculating the CPI for the base year, you are always going to get a 100 as the answer. The reason for this is because you divide the value of the market basket for the base year by itself.
2016 CPI = ($100/$100) x 100 = 100
2017 CPI = ($120/$100) x 100 = 120
2018 CPI = ($125/$100) x 100 = 125
2016 to 2017 Inflation Rate = ((120-100)/100) x 100 = 20%
2016 to 2018 Inflation Rate = ((125-100)/100) x 100 = 25%
Browse Study Guides By Unit
💸Unit 1 – Basic Economic Concepts
📈Unit 2 – Economic Indicators & the Business Cycle
💲Unit 3 – National Income & Price Determination
💰Unit 4 – Financial Sector
⚖️Unit 5 – Long-Run Consequences of Stabilization Policies
🏗Unit 6 – Open Economy - International Trade & Finance
🤔Exam Skills
📚Study Tools
Fiveable
Resources
© 2025 Fiveable Inc. All rights reserved.