Jeanne Stansak
AP Microeconomics 🤑
95 resources1.1: Scarcity
Microeconomics vs. Macroeconomics
Factors of Production
- Land— natural resources and raw materials used to make products. Ex: water, vegetation, oil, minerals, and animals. 🚜
- Labor— the effort, skills, and abilities that individuals devote to a task for which they get paid. 👷
- Capital— these types of resources can be divided into two types, physical capital and human capital
- Physical Capital— the tools and equipment used to produce a good or service. 🔧
- Human Capital—the education and training an individual has that is used in the production of a good or service. 🧠
- Entrepreneurship—the ability of an individual to coordinate the other categories of resources to invent or produce a good or service. Ex: Bill Gates, Steve Jobs, and Henry Ford. 🚗
Opportunity Costs and Trade-offs
| Production Possibilities | Combo A | Combo B |
| Cars | 8 million | 2 million |
| Trucks | 2 million | 10 million |
1.2: Resource Allocation and Economic Systems
Three Economic Questions
- What goods and services will be produced? Since scarcity exists, no society has the resources to produce everything that the people want, leading to this question. An economy has to decide what goods and services are most wanted and needed. For example, when an economy chooses between building or fixing roads, or buying textbooks for schools. This can also involve making decisions like whether the government should conserve wilderness areas or open them up for development.
- How will goods and services be produced? This question deals with how businesses and other producers should go about producing various goods and services. For example, asking whether pipes should be made out of copper or plastic, or whether clothing should be made by machines or made by hand.
- For whom will the goods and services be produced? This question is answered after the production of goods and services, as it is decided who should be allowed to consume the goods and services that have been produced. For example, should it be based on a first-come, first-served basis or based on whether the consumer can afford the goods or services?
Types of Economic Systems
- Centrally-Planned (Command) Economic System
- In this type of economic system, the government makes the basic economic decisions and answers the three basic questions. The government decides what goods and services to produce, prices for these items, as well as wage rates. Some examples of command economies are North Korea and Cuba. 🇰🇵 🇨🇺
- The advantage of this type of economic system is that it is easier to produce goods and make sure everyone is receiving the basic necessities. They are also able to gather resources quickly and on a large scale.
- The disadvantage of this type of economic system is that the system is not responsive to consumers' preferences and it discourages innovation.
- Market Economic System
- In this type of economic system, economic decisions are guided by the changes in price that occur as individual buyers and sellers interact in the marketplace. Some examples of market economies are China and Japan. 🇨🇳 🇯🇵
- Consumers are the part of the economy that answers the question of what to produce while producers answer the question of how to produce. Prices tend to guide the answers to the questions for whom to produce.
- Two of the best advantages of the market economic system are that there is a lot of competition and there is a lot of variety provided in the type of goods and services. Competition keeps both the costs of production and the prices of goods and services low.
- The disadvantages include a large wealth disparity for individuals living in this economic system and very few public goods.
- Mixed Economic System
- A mixed economy is one in which there are characteristics of both the market economy and the command economy present. In a mixed economy, private property rights are protected and there is a certain level of economic freedom, but the government is also allowed to intervene in an effort to meet societal aims. The United States is a great example of a mixed economic system. 🇺🇸
- The advantages of this type of economic system are that it has the advantages of a market economy, including being able to distribute goods and services to where they are most needed, and it allows prices to measure supply and demand. Another advantage is that it rewards the most efficient producers with the highest profit, as well as encouraging innovation in an effort to meet customer needs.
- This type of economic system can also take on the disadvantages of other types of economies so it depends on which characteristics it emphasizes. For example, if they emphasize too much freedom, it can leave some members of society without any government support. The central planning aspect could also create some problems depending on the degree of government involvement.
1.3: Production Possibilities Curve (PPC)
Introduction to the Production Possibilities Curve (PPC)
- Only two goods can be made
- Resources are fixed
- Technology is fixed
- Efficiency
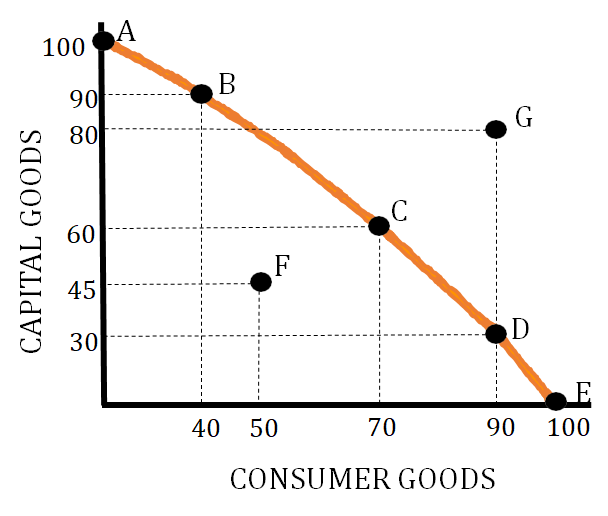
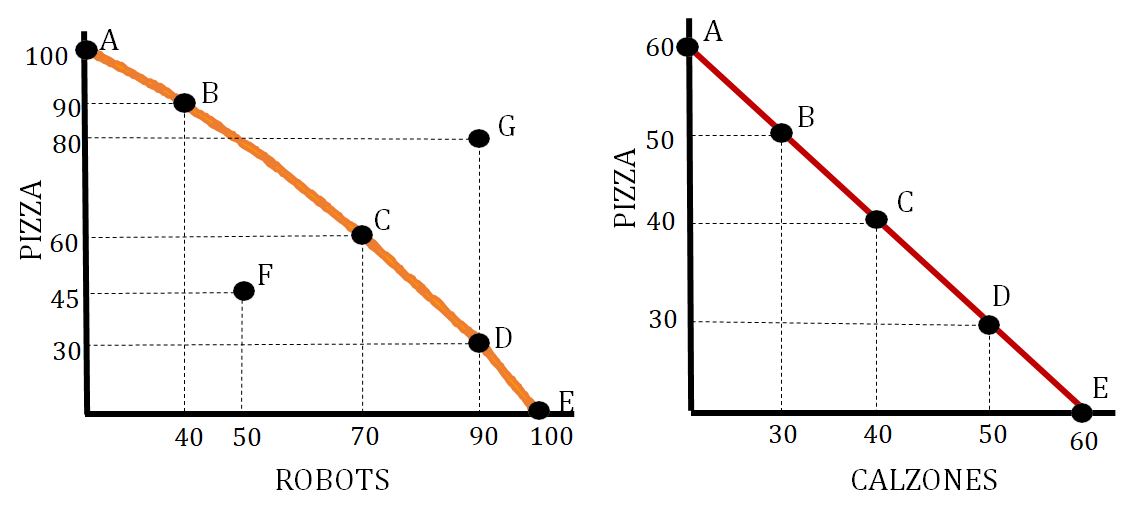
- Allocative Efficiency— This efficiency means we are producing at the point that society desires. This is represented by a point on the production possibilities curve that meets the desires and needs of a particular society. If you are given the situation where a particular society needs about an equal amount of sugar and wheat then the allocatively efficient point would be C.
- Productive Efficiency— This efficiency means we are producing at a combination that minimizes costs. This is represented by any point on the production possibilities curve. In the below graph this is represented by points A, B, C, D, and E.
- Point F in the graph below represents an inefficient use of resources. You can produce at this point, but you are not using all your resources as efficiently as possible.
- Point G represents a production level that is unattainable. At this point, you do not have the needed amounts of resources to produce the number of goods shown.
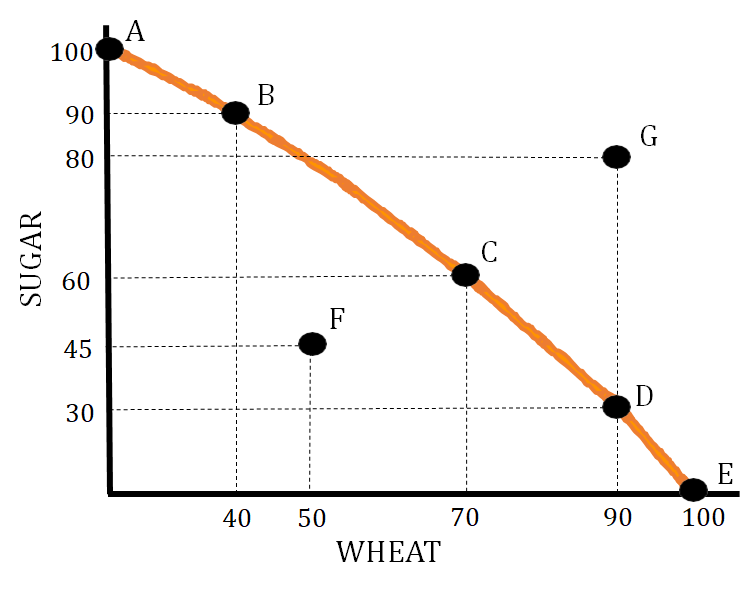
- Scarcity Since scarcity is a situation where there are limited resources versus unlimited wants, a production possibilities curve is used to show how we produce goods and services under this condition. This is shown in the graph above by showing how, given a fixed set of resources, we can produce either combination A, B, C, D, or E.
- Opportunity Cost/Per Unit Opportunity Cost
- This is the value of the next best alternative. We represent this as what we are losing when we change our production combination. For example, moving from A to B on the graph above has an opportunity cost of 10 units of sugar. Per unit opportunity cost is determined by dividing what you are giving up by what you are gaining. So for the graph above, the per unit opportunity cost when moving from point A to point B is 1/4 unit of sugar (10 sugar / 40 wheat).Opportunity Cost can also be determined using a production possibilities table:
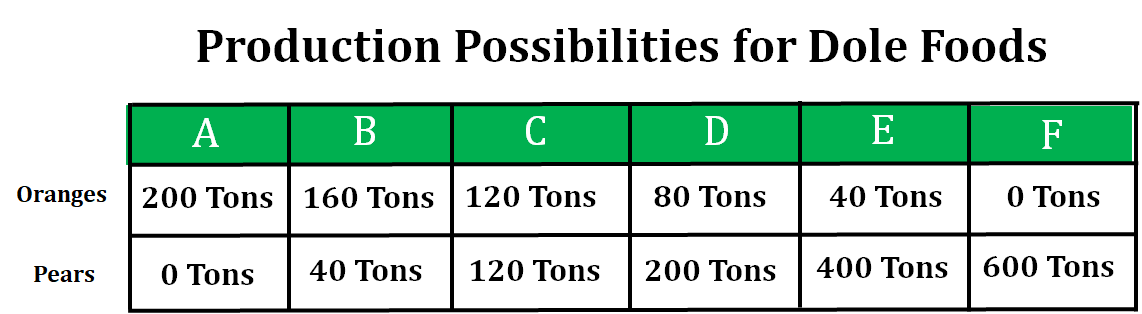
The opportunity cost of moving from point C to D is 40 tons of oranges. The per unit opportunity cost of moving from point C to point D is 1/2 ton of oranges (40 tons of oranges/80 tons of pears).
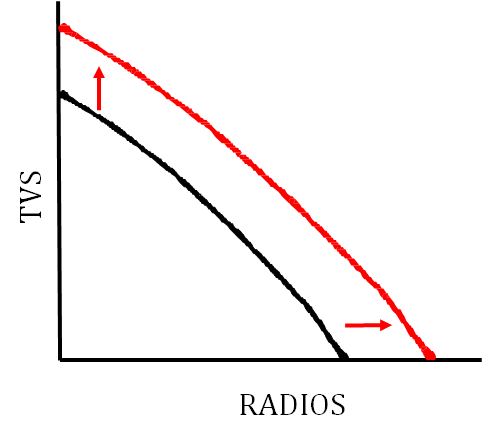
- Economic Growth
- Economic growth is shown by a shift to the right of the production possibilities curve.
- Economic Contraction
- Economic contraction is shown by a leftward shift of the production possibilities curve.
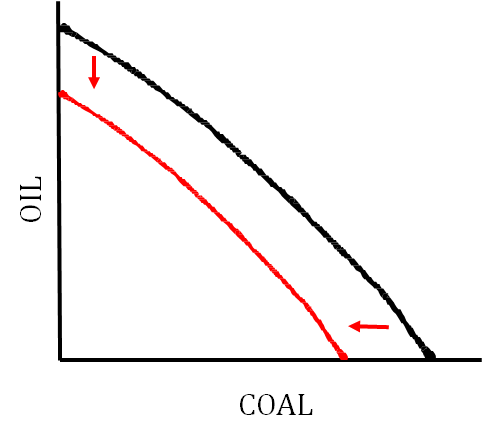
Constant Opportunity Cost vs. Increasing Opportunity Cost
The graph on the left is showing increasing opportunity cost and the graph on the right is showing constant opportunity cost.
Shifters of the Production Possibilities Curve (PPC)
- Change in the quantity or quality of resources
- Change in technology
- Trade
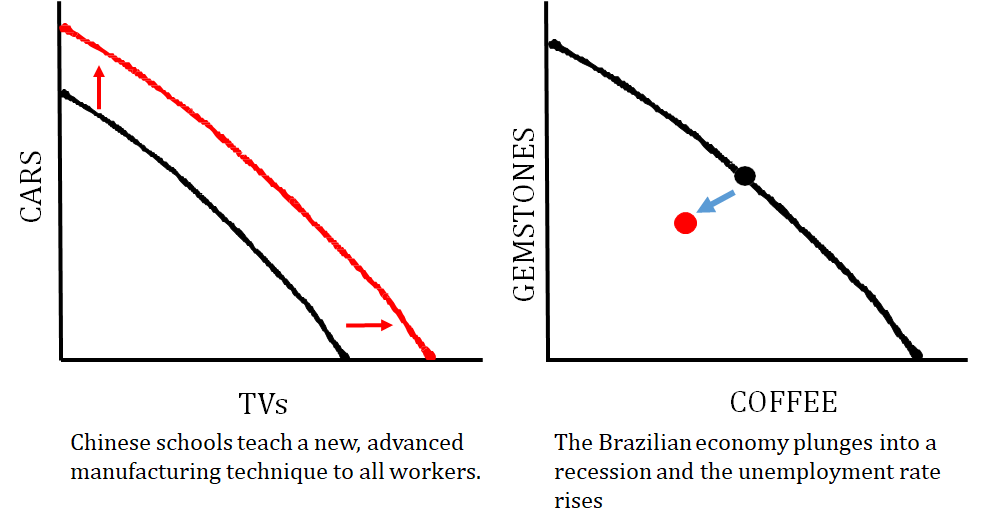
The graph on the left shows how an improvement in the quality of resources impacts the graph. The graph on the right shows what happens when a country is producing at an inefficient point.
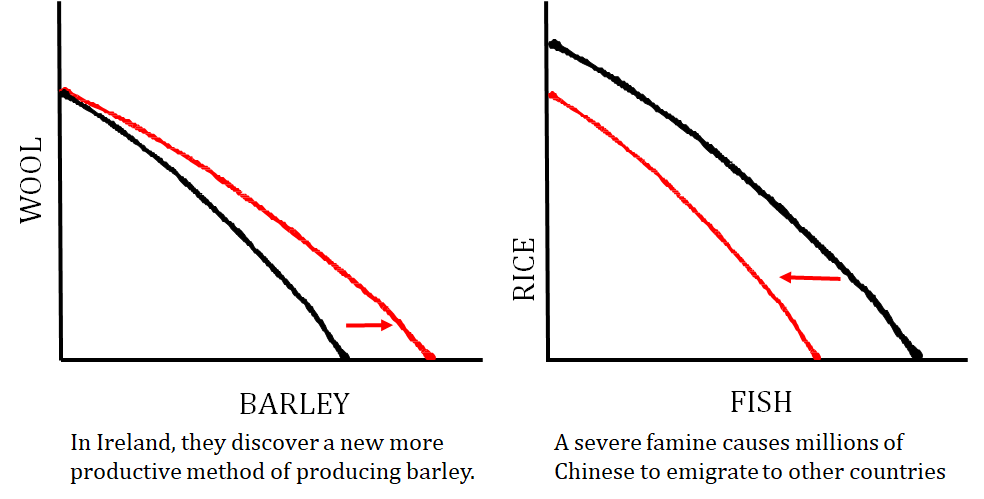
The graph on the left shows a technology change that just impacts one good that a country produces, and the graph on the right shows what happens when the quantity of resources changes (i.e. number of workers decrease).
1.4: Comparative Advantage and Trade
Key Terms
- Absolute Advantage— the ability to produce more of a good or service with a given amount of resources than someone else.
- Comparative Advantage— the ability to produce a good at the lowest opportunity cost.
- Terms of Trade— the rate at which one good can be exchanged for another.
Introduction
Output Problems
- To determine the absolute advantage you are simply looking for which country can produce a higher amount of the good or service.
- To determine comparative advantage you have to calculate per unit opportunity cost using the formula give up/gain (the amount of good you are giving up divided by the amount of good you are gaining). Once you have calculated per unit opportunity cost, the country with the lowest one has a comparative advantage.
- If the two countries can both make the same amount of the good, then we say neither country has an absolute advantage.
- Countries export what they have a comparative advantage in and import what they don't have a comparative advantage in.
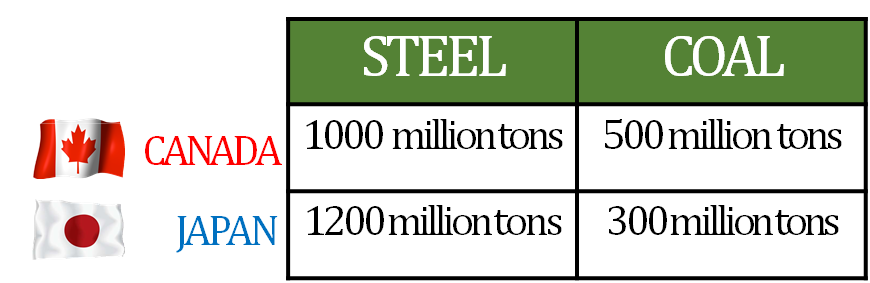
Determining Absolute Advantage
Determining Comparative Advantage
Terms of Trade
- 1 coal = 3 units of steel
- 1 steel = 1/3 units of coal
Input Problems
- To determine absolute advantage, you are looking for the country that uses the least amount of resources (i.e. the lower number)
- To determine comparative advantage, you have to calculate the per unit opportunity cost using the formula gain/give up. Once you have calculated the per unit opportunity cost the country with the lowest one has a comparative advantage.
- If the two countries both can make one unit of the good with the same amount of resources, then we say neither country has an absolute advantage.
- Countries export what they have a comparative advantage in and import what they don't have a comparative advantage in.

Determining Absolute Advantage
Determining Comparative Advantage
Terms of Trade
- 1 truck for 1.5 cars
- 1 car for 3/4 of a truck
1.5: Cost-Benefit Analysis
Two Types of Costs
Sample Questions
Question 1
- Answer: $20,000
- Explanation: Opportunity cost includes both explicit and implicit costs. In this question, the $15,000 in salary for the internship you gave up is an implicit cost and the $5,000 in tuition and fees are explicit costs of going to the community college.
Question 2
- Answer: Choice E
- Explanation: No matter what decision you make you will have clothing expenses.
Question 3
- Answer: $135
- Explanation: Sylvia would have earned $60 from working for 5 hours (5 times $12). She also spent $75 on the ticket. 60 + 75 = 135
Question 4
1.6: Marginal Analysis and Consumer Choice
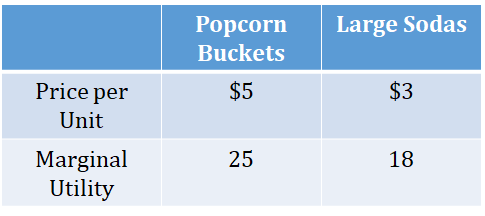
The Rules for Utility Maximization
- The consumer will spend all of their income.
- The consumer will buy only two goods.
- When choosing which good to buy next, the consumer will always choose the good with the greatest MU/P (Marginal Utility per dollar).
- When a consumer stops buying, the MU/P of the last unit of each good should equal each other.
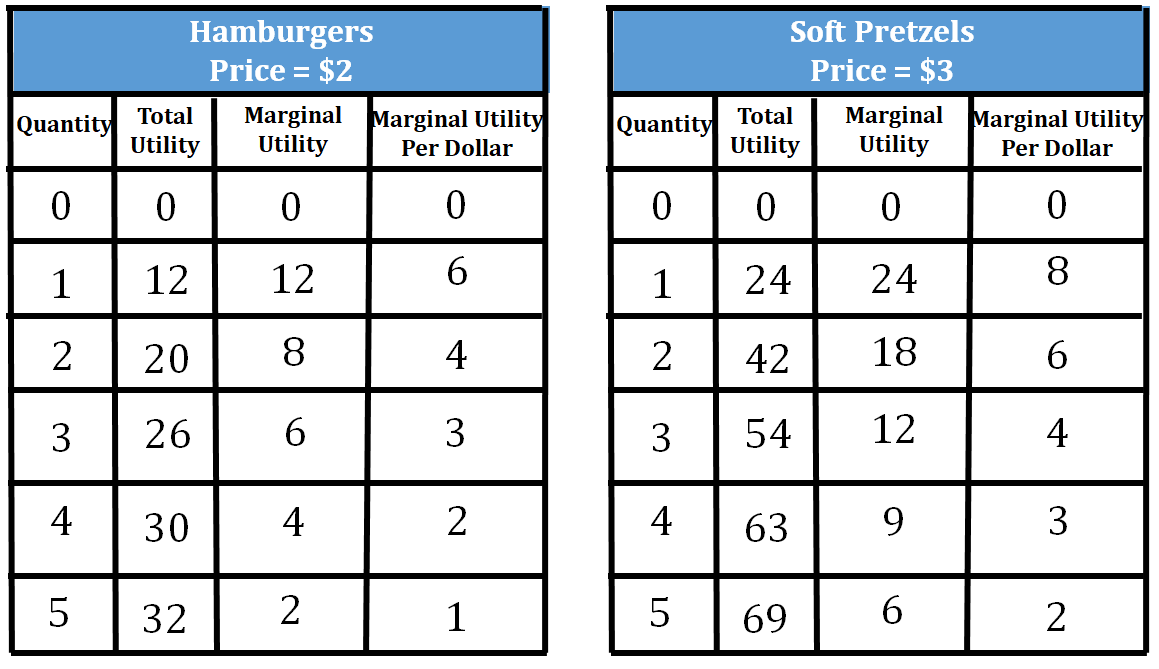
Steps for working these problems
- If you are given total utility (TU), you must first calculate marginal utility (MU). To calculate the MU, you subtract the TU going from one unit to another. Sometimes the problems will give you marginal utility (MU), and then you can jump right to the second step.
- Once you have marginal utility (MU), calculate marginal utility per dollar (MU/P). This is done by dividing your marginal utility (MU) by the price of the product.
- Once you have calculated all these values, the consumer will look to buy the good that has the greatest MU/P first. You, then, subtract the cost of that good from your budget.
- You continue this process until you have spent all of your budget.
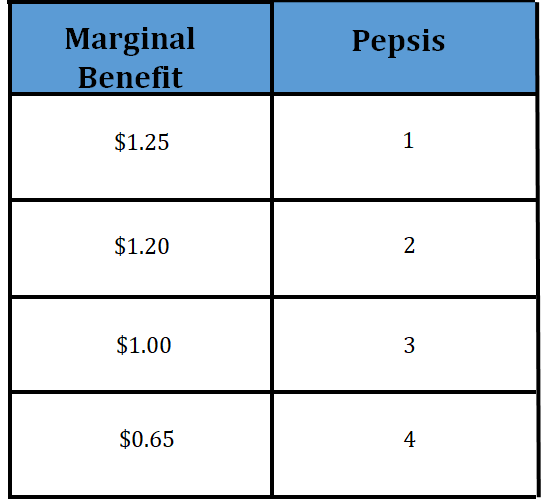
Sample Problem
Another Example
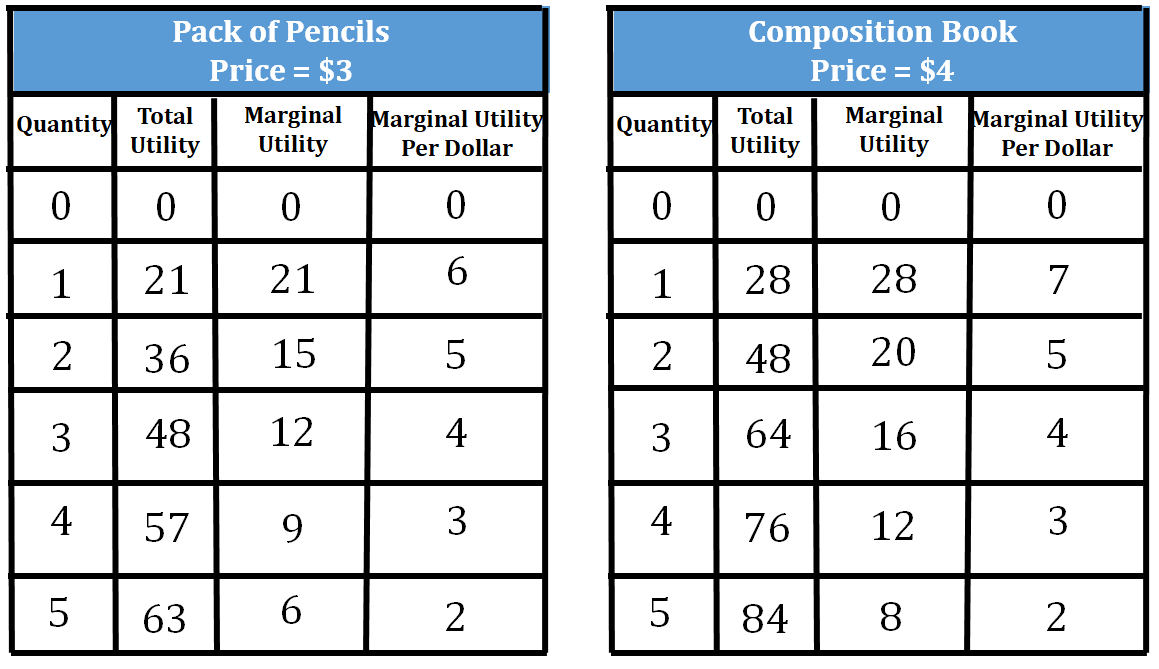
Example
- Unit 1 Overview: Basic Economic Concepts
- 1.1: Scarcity
- Microeconomics vs. Macroeconomics
- Factors of Production
- Opportunity Costs and Trade-offs
- 1.2: Resource Allocation and Economic Systems
- Three Economic Questions
- Types of Economic Systems
- 1.3: Production Possibilities Curve (PPC)
- Introduction to the Production Possibilities Curve (PPC)
- Constant Opportunity Cost vs. Increasing Opportunity Cost
- Shifters of the Production Possibilities Curve (PPC)
- 1.4: Comparative Advantage and Trade
- Key Terms
- Introduction
- Output Problems
- Input Problems
- 1.5: Cost-Benefit Analysis
- Two Types of Costs
- Sample Questions
- 1.6: Marginal Analysis and Consumer Choice
- The Rules for Utility Maximization
Fiveable
Resources
© 2023 Fiveable Inc. All rights reserved.