J
Jeanne Stansak
AP Microeconomics 🤑
95 resourcesSee Units
What is Demand?
A market is an economic system that brings together producers (such as firms) that supply goods and consumers (buyers) that demand them. Demand is a fundamental concept in economics that refers to the desire for a good or service, as well as the willingness and ability to pay for it. In a market, demand represents the side of the relationship that is made up of buyers who seek to purchase goods and services from sellers. Demand is an important factor that drives the market and determines the prices of goods and services. We define demand as the relationship between the quantity of a good that consumers are willing and able to buy and the price of that good.
The Law of Demand
The Law of Demand is the fundamental principle behind understanding the demand curve. The Law of Demand states that as the price for a good increases, the quantity demanded decreases, and vice-versa. This is a fairly intuitive law. Suppose you were buying only chocolate bars. If the price of a chocolate bar was $0.50, then you may buy 10 bars. However, if the price increased to $2.00, you may only buy 3. There are a number of reasons for the law of demand:
- The Substitution Effect refers to the way in which consumers respond to changes in the price of a good by switching to a substitute good. When the price of a good increases, consumers will generally buy less of it and more of a substitute good that is similar but cheaper. This is because the higher price makes the original good less appealing relative to the substitute good. Conversely, when the price of a good decreases, consumers will generally buy more of it and less of the substitute good, because the original good is now more appealing relative to the substitute good. For example, when chocolate got more expensive, you may substitute away from chocolate and towards mints.
- The Income Effect refers to the way in which changes in the price of a good affect a consumer's purchasing power. When the price of a good increases, a consumer's purchasing power decreases, because they can buy less of the good with the same amount of income. This means that they will likely buy less of the good and more of other, cheaper goods in order to make their income stretch further. Conversely, when the price of a good decreases, a consumer's purchasing power increases, because they can now buy more of the good with the same amount of income. This means that they will likely buy more of the good and less of other, more expensive goods.
- The Law of Diminishing Marginal Utility is a concept in economics that refers to the way in which the additional satisfaction that a person gets from consuming a good decreases as they consume more of it. This means that the first unit of a good will typically provide more satisfaction than the second, the second more than the third, and so on. This is because as people consume more of a good, they become less and less hungry or thirsty, for example, and therefore get less satisfaction from each additional unit of the good. As price increases, the costs associated with consumption increase, and thus it takes fewer units to reach where MB = MC.
These three effects contribute to the law of demand, which dictates why the demand curve is downward sloping, which we'll discuss in the next section.
📉 Graphing Demand
In a market, we relate quantites of goods to prices. Thus, on our graph of demand, quantity will go on the x-axis and price will go on the y-axis. This is one of the most common axis combinations in economics.
❓ Note! You may be confused why quantity goes in the x-axis when it's determined by price as per the law of demand. This is because in most graphs, economists put the dependent variable on the x-axis. This has historical roots. It's a bit tricky to get a handle on but eventually it becomes second nature!
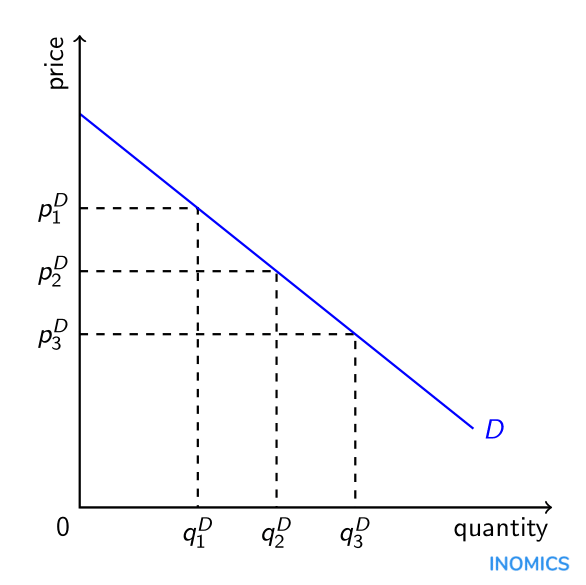
The law of demand tells us that as price decreases, quantity demanded increases, so our demand curve is a downward sloping curve. When you graph a demand curve, you can graph either a straight line or a curve, as long as it's strictly downward sloping.

As you can see, at P1, the quantity demanded is Q1. When price decreases, Q increases to Q2. This displays the law of demand in action!
Differentiating Demand and Quantity Demanded
In this guide, we've used two terms: quantity demanded and demand. At first, it may seem that these two terms mean the exact same thing, but there's a slight difference between the two.
Demand refers to the overall desire for a good or service, as well as the willingness and ability to pay for it. It is a concept that represents the total amount of a good or service that consumers are willing to buy at a given price, over a certain time period. Demand is often depicted graphically as a demand curve, which shows the relationship between the quantity of a good or service that consumers are willing to buy and the price of the good or service.
On the other hand, quantity demanded refers to the specific amount of a good or service that a consumer is willing to buy at a given price, at a specific point in time. Quantity demanded is a point on the demand curve and is affected by factors such as price, income, and the prices of substitute and complementary goods.
This becomes incredibly important when we talk about shifters of demand. This is because changes in price do not impact the entire demand curve, but rather are a movement along the curve.
Shifting Demand
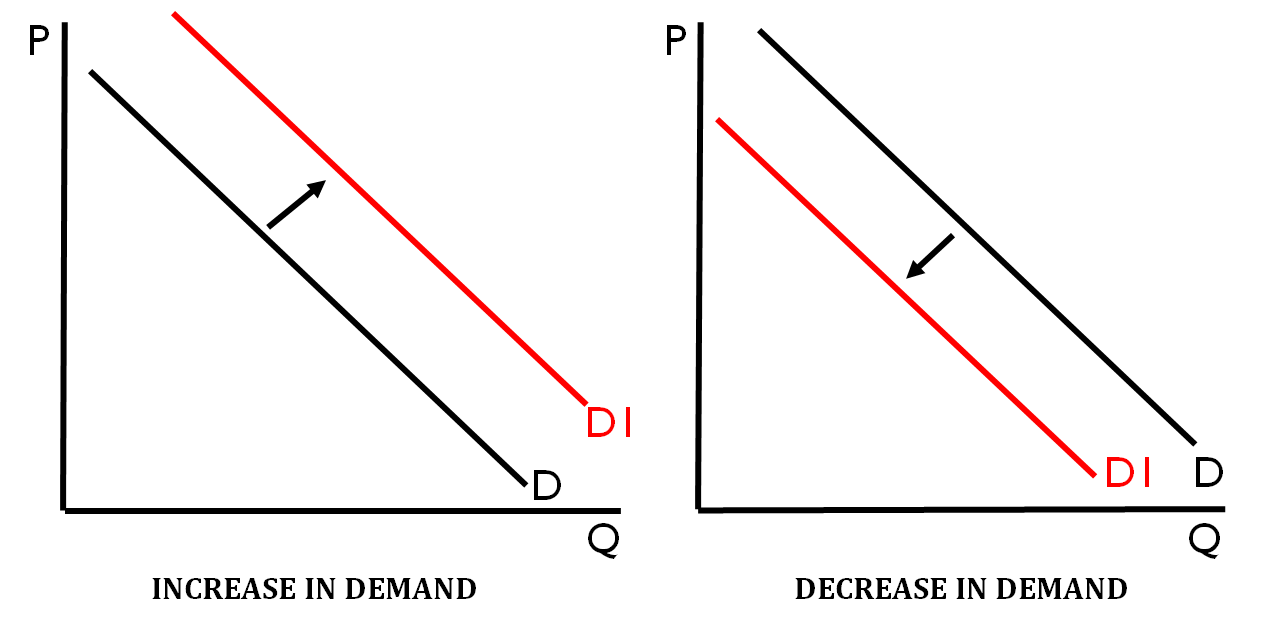
When certain events happen outside of the market, the quantity demanded can change for every single price point. This is visually represented as a shift in the demand curve either right to indicate an increase in demand, or left to indicate a decrease in demand. The main shifters, or determinants of demand, can be remembered using the acronym I-N-S-E-C-T.
Income: Changes in a consumer's income can affect their demand for certain goods or services. For example, if a consumer's income increases, they may have more disposable income to spend on higher-priced or luxury goods, leading to an increase in demand. Conversely, if a consumer's income decreases, they may be more inclined to switch to cheaper alternatives, leading to a decrease in demand for the original good or service.
Number of Consumers: The number of consumers in a market can also affect demand. If the population or the number of potential consumers in a market increases, demand may also increase. Conversely, if the number of consumers decreases, demand may also decrease.
Substitute: The availability of substitute goods or services can also affect demand. If a substitute good or service becomes more widely available or attractive, demand for the original good or service may decrease, as consumers switch to the substitute.
Expectation: Expectations about the future can also affect demand. If consumers expect the price of a good or service to increase in the future, they may be more inclined to buy it now, leading to an increase in demand. Conversely, if consumers expect the price to decrease in the future, they may be more inclined to wait, leading to a decrease in demand.
Complement: The demand for a good or service can also be influenced by the availability of complementary goods or services. For example, if the demand for a particular type of car increases, the demand for car tires may also increase, as tires are a complementary good for cars.
Taste: Changes in consumer tastes and preferences can also affect demand. If a good or service becomes more popular or fashionable, demand may increase. Conversely, if a good or service becomes less popular or fashionable, demand may decrease.
- When price level increases, the quantity of a good demanded decreases.
- When price level decreases, the quantity of a good demanded increases.
Determinants are factors that can cause the entire demand curve to increase or decrease. When there is an increase in demand (see graph below), the demand curve will shift right. When at every price level, there is an increase in the quantity demanded. When there is a decrease in demand (see graph below), the demand curve will shift left. At every price level, there is a decrease in quantity demanded.

Browse Study Guides By Unit
💸Unit 1 – Basic Economic Concepts
📈Unit 2 – Supply & Demand
🏋🏼♀️Unit 3 – Production, Cost, & the Perfect Competition Model
⛹🏼♀️Unit 4 – Imperfect Competition
💰Unit 5 – Factor Markets
🏛Unit 6 – Market Failure & the Role of Government
🤔Exam Skills
📚Study Tools

Fiveable
Resources
© 2025 Fiveable Inc. All rights reserved.