7.6 Confidence Intervals for the Difference of Two Means
3 min read•june 18, 2024
Jed Quiaoit
Josh Argo
AP Statistics 📊
265 resourcesSee Units
Sometimes in statistical studies, it is important to compare two different populations to see if they are different. For instance, what if we want to compare the weights of two types of apples: 🍏 vs. 🍎. Perhaps we believe that the weight of 🍎 is more than 🍏 or maybe we just think they are different. Either way, we have the statistical means to be able to check if the weights are different or if one weighs more than the other. One option of comparing these two populations is to create a confidence interval for the difference of two population means.
Conditions
As with any act of statistical inference, we must check our conditions for inference prior to performing any calculations.
(1) Random
As always, it absolutely essential that your samples come from a randomized process since we seek to infer things about a population. Since we are dealing with two populations, both samples must be random. If you are performing an experiment to check the difference in two populations, you must verify that both samples were randomly assigned to treatments, not just randomly selected. ⭐
(2) Independent
Since we are generally sampling without replacement, we must check to be sure that the samples are independent. We can use this by checking the 10% condition for both samples. 🧠
💡 NOTE: If doing an experiment, it is not necessary to check the 10% condition. A randomized experiment is sufficient for independence.
(3) Normal
To check normality of a sampling distribution for the difference in two population means, we have to be sure that both samples have approximately normal sampling distributions. This can be done using the Central Limit Theorem (n ≥ 30), verifying that both populations are normally distributed, or a box plot of both samples show no strong skewness or apparent outliers. 🔔
Calculations
To calculate a confidence interval for the difference in two population means, we must first calculate our point estimate and margin of error.
Point Estimate
Our point estimate is what we believe the difference between the two populations is based off of our sample means. To find this, we simply subtract our two sample means. ⛳

Margin of Error
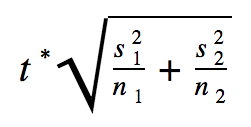
Our margin of error is what we add/subtract to our point estimate to create our confidence interval. For a confidence interval for the difference of two population means, the formula for margin of error is below: ❌

Calculator Commands
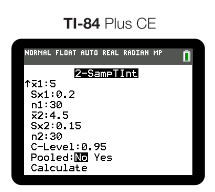
A much easier, more efficient way of calculating a confidence interval for the difference in two population means is to use technology such as a graphing calculator. On a TI-84, you would start by going into the stats menu, scrolling to test and selecting 2 Sample T Interval, where you would put in the given statistics to calculate the confidence interval.
Example
Let's say that we have a bag of green apples and a bag of red apples and we want to estimate the difference in population means of the two types of apples. Our sample of 30 🍏s weigh a mean of 5 oz with a standard deviation of 0.2 oz and our sample of 30 🍎s weigh a mean of 4.5 oz with a standard deviation of 0.15 oz. Create and interpret a confidence interval for the difference in the two population means of the weights of green apples and red apples.
The easiest way to construct your interval is to use technology such as a graphing calculator to do so:

We always select "not pooled" doing two sample intervals and tests. This is because we do not know if the populations have equal variances. After calculating we get the following interval: (0.408, 0.592).
🎥 Watch: AP Stats - Inference: Confidence Intervals for Means
Browse Study Guides By Unit
👆Unit 1 – Exploring One-Variable Data
✌️Unit 2 – Exploring Two-Variable Data
🔎Unit 3 – Collecting Data
🎲Unit 4 – Probability, Random Variables, & Probability Distributions
📊Unit 5 – Sampling Distributions
⚖️Unit 6 – Proportions
😼Unit 7 – Means
✳️Unit 8 – Chi-Squares
📈Unit 9 – Slopes
✏️Frequently Asked Questions
📚Study Tools
🤔Exam Skills

Fiveable
Resources
© 2025 Fiveable Inc. All rights reserved.