7.1 Introducing Statistics: Should I Worry About Error?
5 min read•june 18, 2024
Jed Quiaoit
Josh Argo
AP Statistics 📊
265 resourcesSee Units

image courtesy of pixabay
No statistical study is perfect and that there is always a chance of error occurring. There are several sources of error that can affect the results of a statistical study, including sampling error, measurement error, and bias. 😵💫
Sampling error occurs when the sample used in the study is not representative of the population being studied. This can lead to incorrect conclusions being drawn about the population based on the sample data.
Measurement error occurs when there is error in the measurement of the variables being studied due to the presence of confounding variables. This can also lead to incorrect conclusions being drawn.
Bias is another source of error that can occur in statistical studies. Bias can occur in the sampling process, the measurement process, or in the analysis of the data. Bias can lead to incorrect conclusions being drawn about the population being studied.
Type I Errors
A Type I error, also known as a false positive, is an error that occurs when the null hypothesis is rejected when it should have been accepted. The probability of a Type I error occurring is equal to the alpha level, which is the level of significance that is chosen for the study. The alpha level is the probability of rejecting the null hypothesis when it is true. A common alpha level is 0.05, which means that there is a 5% chance of making a Type I error. ➕
It's important to choose an appropriate alpha level for a study, as a lower alpha level (e.g. 0.01) will result in a higher probability of making a Type I error, while a higher alpha level (e.g. 0.1) will result in a lower probability of making a Type I error.
It's also crucial to consider the consequences of making a Type I error, as rejecting the null hypothesis when it is true can lead to incorrect conclusions being drawn about the population being studied.
Example
Let's say an author claims that the mean income for a given area is $45,000. 💸
We sample a group of 50 families and find that the mean income of our sample is $60,000 with a standard deviation of $2,500. In performing a statistical test, we would reject the author's claim. If we made an error in our study (either due to sampling or random chance), this would be a Type I error.
Type II Errors
A Type II error, also known as a false negative, is an error that occurs when the null hypothesis is not rejected when it should have been. This means that the null hypothesis is accepted when it is actually false. ➖
Type II errors are more likely to occur when the sample size is small, as there is less power in the statistical test to detect a true difference between the population and the sample. Recall from the previous unit that the power of a statistical test is the probability of correctly rejecting the null hypothesis when it is false.
Like the probability of a Type I error, the probability of a Type II error is influenced by the alpha level and the sample size. A higher alpha level and a larger sample size will result in a lower probability of making a Type II error.
It is important to consider the consequences of making a Type II error, as failing to reject the null hypothesis when it is false can lead to incorrect conclusions being drawn about the population being studied.
Example
Let's say an author claims that the mean income for a given area is $45,000. 💸
We sample a group of 50 families and find that the mean income of our sample is $44,500 with a standard deviation of $1,000. In performing a statistical test, we would fail to reject the author's claim. If we made an error in our study (either due to sampling or by random chance), this would be a Type II error.
How to Minimize Error in Statistical Studies
(1) Minimizing error due to bias in sampling
✔️ Select a random sample using a method such as simple random sampling.
- Example: A band director wants to survey the school on their opinions of this year's half-time show. To perform the survey, he numbers each student in the school with a number and uses a random number generator to select 20 students. This is a GOOD example of how to select a random sample.
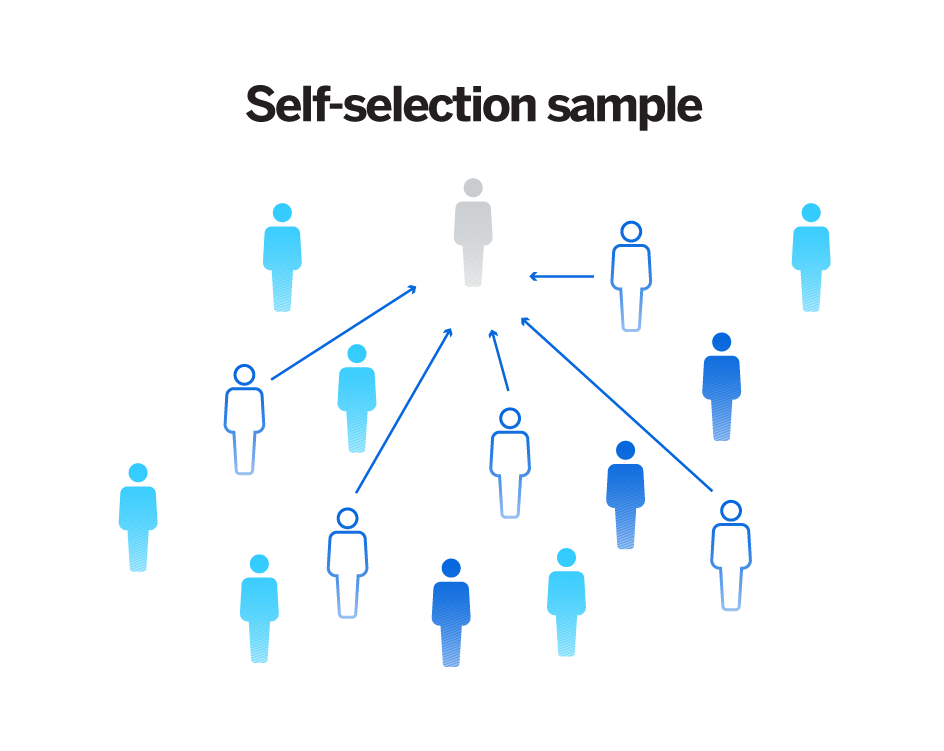
❌ Avoid volunteer samples, convenience samples and other sampling methods that may heavily influence your data in one direction.
- Example: A band director wants to survey the school on their opinions of this year's half-time show. To perform the survey, he chooses the first 20 students who arrive at the Fall Band Concert and asks them if the band's show is satisfactory. This is a BAD example of how to select a random sample since he is only using students who were coming to the band concert (convenience sample).

Source: Qualtrics
(2) Minimizing error due to bias in questioning
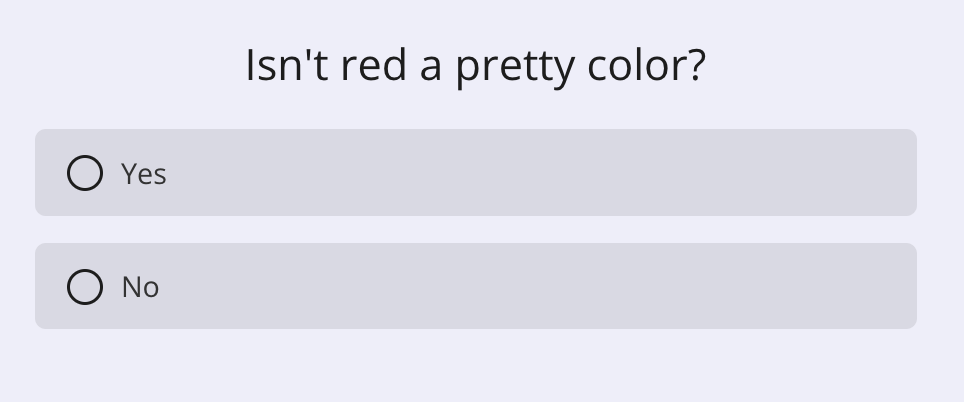
❌ Avoid asking questions in a way that will prompt a certain response
- Example: If the band director wants to know how the half-time show was, he should ask the question in a way such as "Rate the band's half time show on a scale of 1-10" as opposed to saying, "Was the band's half-time show good?" The latter way of asking the question will likely influence the student's to say "yes". This is known as response bias.
❌ Avoid having someone ask questions that may influence the response (for example, don't have a police officer ask someone if they have ever broken the speed limit)
- Example: If the band director wants to know how the half-time show was, an anonymous survey would be the best way. If the band director asked the students directly, they may feel more inclined to give it a higher rating (especially if their grade in class could be influenced by the way they feel).

Source: Survicate
(3) Minimizing error due to confounding variables
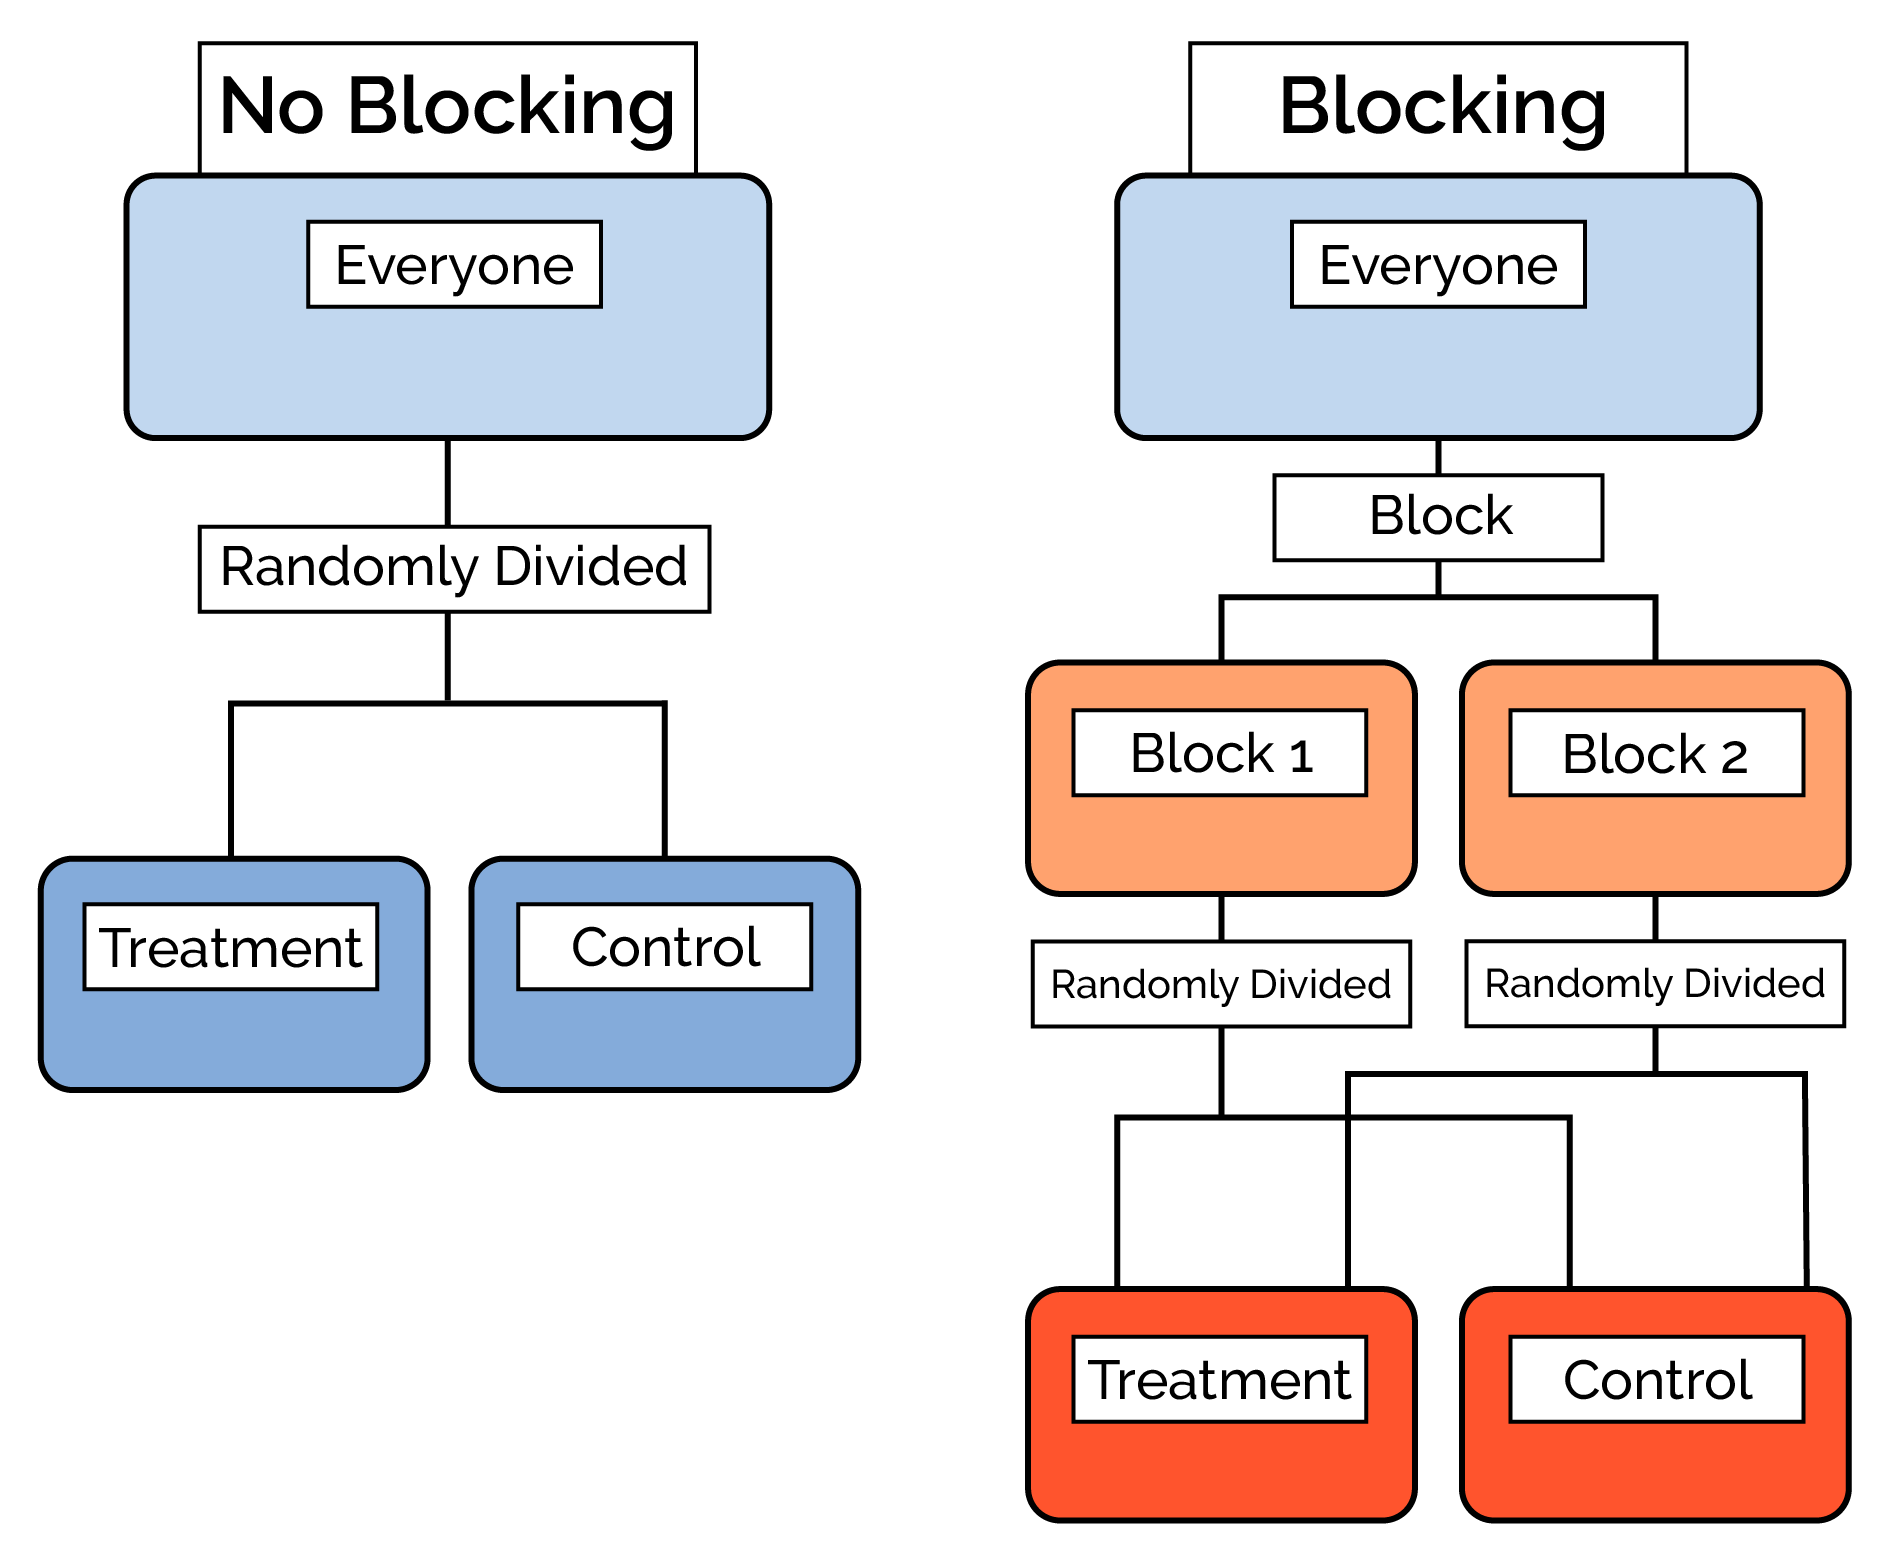
✔️ Use blocking in your experiment to account for any known or suspected confounding variables.
- Example: If the band director wants to know how the student body feels about the half-time show, the band director may consider blocking by grade. That would ensure an equal amount of responses from each class and make sure that the age of students was not a confounding variable.

Source: Data Science Discovery
Browse Study Guides By Unit
👆Unit 1 – Exploring One-Variable Data
✌️Unit 2 – Exploring Two-Variable Data
🔎Unit 3 – Collecting Data
🎲Unit 4 – Probability, Random Variables, & Probability Distributions
📊Unit 5 – Sampling Distributions
⚖️Unit 6 – Proportions
😼Unit 7 – Means
✳️Unit 8 – Chi-Squares
📈Unit 9 – Slopes
✏️Frequently Asked Questions
📚Study Tools
🤔Exam Skills

Fiveable
Resources
© 2025 Fiveable Inc. All rights reserved.