7.3 Justifying a Claim About a Population Mean Based on a Confidence Interval
4 min read•june 18, 2024
Jed Quiaoit
Josh Argo
AP Statistics 📊
265 resourcesSee Units
A statistical claim for the population mean is a statement about the mean or average value of a particular population. This claim is often based on data collected from a sample of the population, and it is used to make inferences about the population as a whole. The population mean is an important measure of central tendency, and it can be used to help understand the characteristics of a population and make predictions about future observations!
For example, looking at the nutritional information on a bag of chicken nuggets, the amount of chicken nuggets per bag is a statistical claim. The company is claiming that the true mean number of chicken nuggets is the listed amount. 🐔
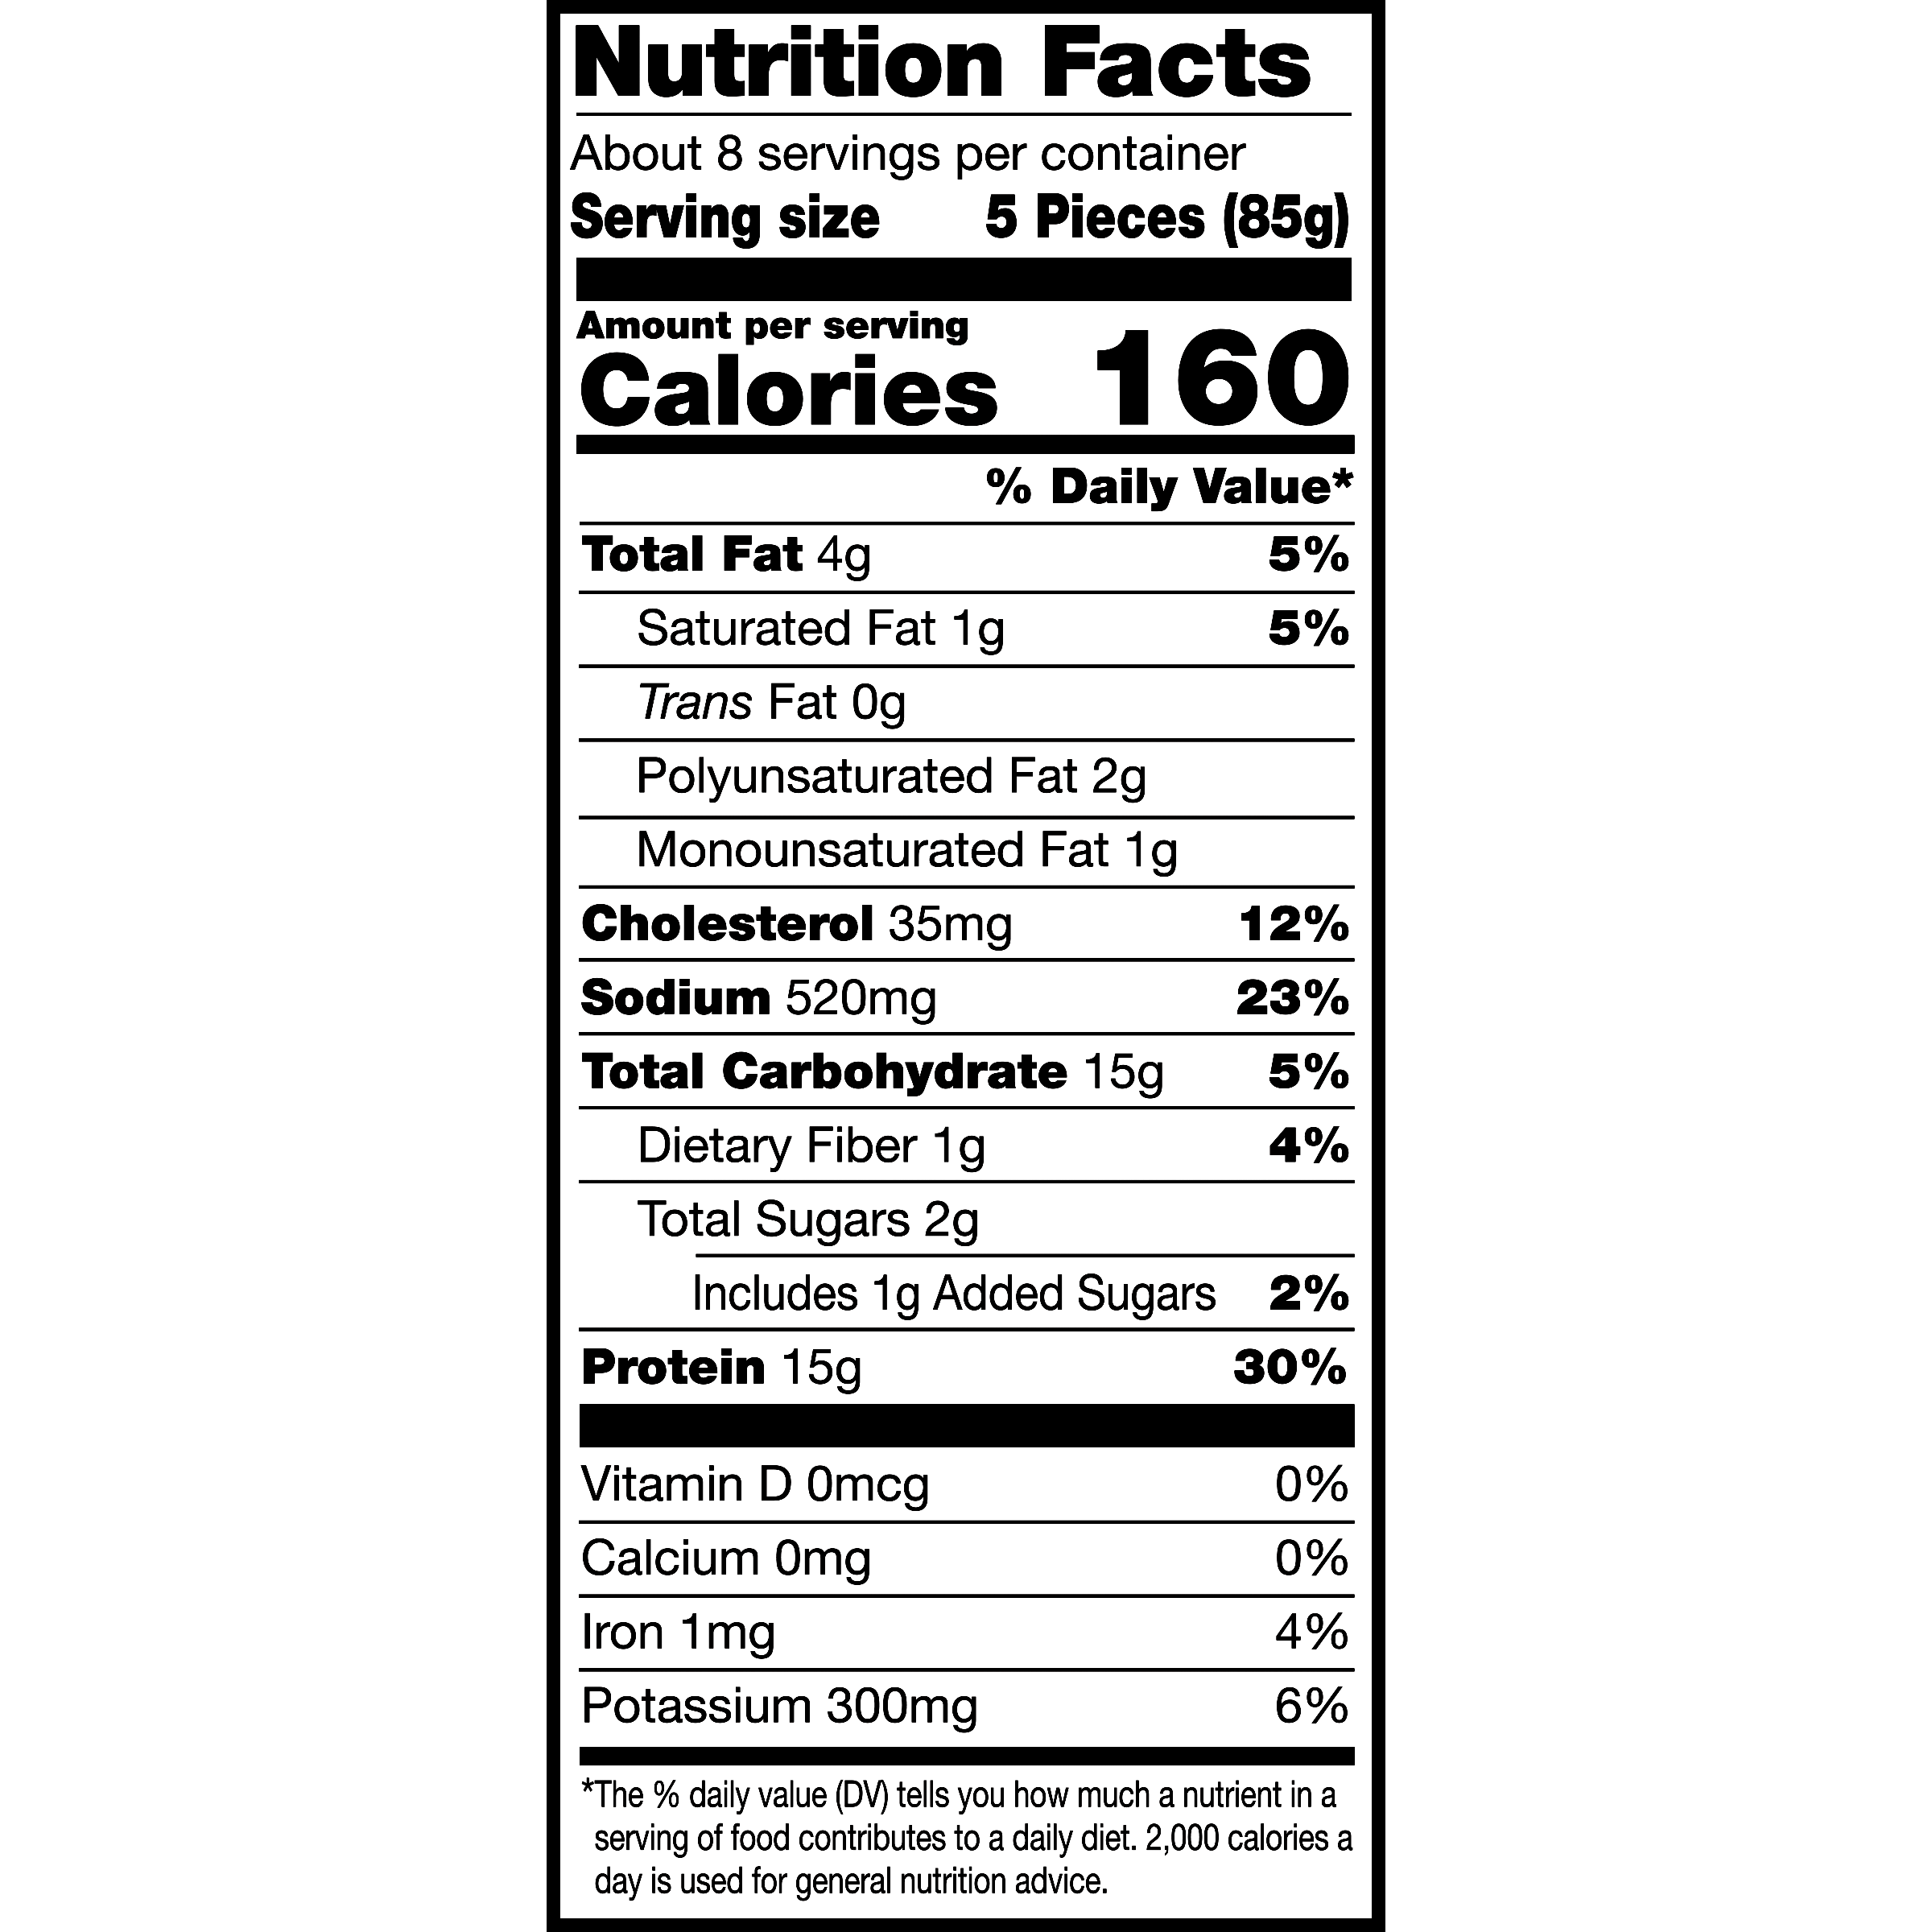
image courtesy of: walmart.com
Setting Up an Experiment
If we want to test a statistical claim about a population mean, we have to create a random, independent sample of at least 30 (Central Limit Theorem) and use the mean and standard deviation of that sample to create your confidence interval.
Remember that the Central Limit Theorem states that the distribution of sample means will be approximately normal, as long as the sample size is large enough (usually n > 30). This means that you can use techniques from inferential statistics, such as constructing a confidence interval, to make inferences about the population mean based on the sample mean. 🎢
In the chicken nugget example, we would pull at least 30 bags of chicken nuggets randomly and count the number of chicken nuggets in each. Take the mean and standard deviation of our data set to construct our confidence interval.
Remember, we will use t scores to construct our interval since we are estimating a population mean.
Importance of Sample Size
When creating a confidence interval, our sample size plays a huge part in our interval. 🧠
Our sample size affects two aspects:
- critical value (t*)
- standard error
Notice that both of these aspects are in the "margin of error" aspect of the confidence interval.
Critical Value
Our critical value for population mean is t score. As you recall from Unit 7.2, our t scores change based on our degrees of freedom (which is based on sample size). As we increase, our sample size, our degrees of freedom will also increase.
For example, if we have a sample size of 41, our degrees of freedom is 40. Looking at our t-chart table (or using your calculator's technology (InvT), we can find that our critical value is 2.021 for a 95% confidence interval.
If we increase our sample size to 51 (df=50), our critical value becomes 2.009.
Therefore, as sample size increases, critical value decreases.
Standard Error
The other aspect of our margin of error that changes with sample size is the standard error. Our standard error formula is found by taking the standard deviation and dividing by the square root of the sample size.
In our example above, if our standard deviation is 1.2, a sample size of 41 yields a standard error of 0.1874
If we increase our sample size to 51, our standard error changes to 0.168
Therefore, as sample size increases, standard error decreases.
Overall Changes
Since both aspects of the margin of error decrease with a larger sample size, we can then conclude that the margin of error decreases as a whole when the sample size increases.
In other words, as our sample size increases, our confidence interval gets thinner, better honing in on the population mean that we are trying to estimate.
Testing the Claim
In order to test the claim of a company or journal article, we look at the range of our confidence interval. If the claimed population mean is contained within the confidence interval that you have constructed, then you cannot reject the claim. This means that the data you have collected is consistent with the claim, and it is reasonable to accept it as true. ✔️
On the other hand, if the claimed population mean falls outside of the confidence interval, then you have reason to believe that the claim may be incorrect. In this case, you may want to conduct additional studies or gather more data to further test the claim.
In our example with the chicken nuggets, let's say that we find 30 bags of chicken nuggets that have an average of 41.4 chicken nuggets with a standard deviation of 1.2 nuggies.
Let's construct the standard 95% T confidence interval:
point estimate ± (critical value)(standard error)
41.4 ± (2.05)(1.2/√30) = (40.951, 41.849)
Making a Conclusion
Looking at our interval above, we can see that the claim from the nutritional facts (40 chicken nuggets) is in fact NOT in our interval. This can lead us to believe that the nutritional information isn't telling the complete truth, but they are in fact giving us EXTRA chicken nuggets! Isn't that amazing? 😁.
And of course, the company is happy because we can't say that we are being cheated out of chicken nuggets. 🙌
Now that's a win-win situation!
Template
"We are C% confident that the confidence interval for a population mean (in context) captures the population mean of ___ (again, in context)."

image courtesy of: knowyourmeme.com
🎥 Watch: AP Stats - Inference: Confidence Intervals for Means
Browse Study Guides By Unit
👆Unit 1 – Exploring One-Variable Data
✌️Unit 2 – Exploring Two-Variable Data
🔎Unit 3 – Collecting Data
🎲Unit 4 – Probability, Random Variables, & Probability Distributions
📊Unit 5 – Sampling Distributions
⚖️Unit 6 – Proportions
😼Unit 7 – Means
✳️Unit 8 – Chi-Squares
📈Unit 9 – Slopes
✏️Frequently Asked Questions
📚Study Tools
🤔Exam Skills
Fiveable
Resources
© 2025 Fiveable Inc. All rights reserved.