7.4 Setting Up a Test for a Population Mean
7 min read•june 18, 2024
Jed Quiaoit
Josh Argo
AP Statistics 📊
265 resourcesSee Units
When given a statistical claim from an article or previous study, the first necessary thing to do is to identify the test needed. Some key phrases you will see that tells us that a statistical significance test is called for is "do the data give convincing evidence..." or "is there convincing evidence of..." 🤔
When one of these key phrases appear in the prompt, we then need to determine if our data is categorical data or quantitative data. If we have quantitative data, we will set up a test for a population mean. As with confidence intervals, a test for population mean will make use of t-scores. If we only have one sample, we will perform a one sample t-test.
A one-sample t-test is used to compare the mean of a sample to a known population mean. It is often used when the standard deviation (σ) of the population is not known. To conduct a one-sample t-test, you first need to determine the null and alternative hypotheses. The null hypothesis is a statement of no difference or no effect, and it is the hypothesis that is being tested, while the alternative hypothesis is the opposite of the null hypothesis, and it is what you hope to show is true. 1️⃣
Significance Level
One major aspect of our significance test is the significance level. The significance level (alpha, 𝞪) is the probability of rejecting the null hypothesis when it is actually true. It is the threshold that you set for determining whether the sample mean is significantly different from the claimed population mean. If the p-value is less than the significance level, then you can reject the null hypothesis and conclude that the sample mean is significantly different from the claimed population mean. 🔝
It's important to choose an appropriate significance level because setting it too low can lead to a high rate of false positives (also known as Type I errors), where you reject the null hypothesis when it is actually true. On the other hand, setting it too high can lead to a high rate of false negatives (also known as Type II errors), where you fail to reject the null hypothesis when it is actually false.
The most common significance level used in research is 0.05, which means that there is a 5% chance of rejecting the null hypothesis when it is actually true. This is often considered a good balance between minimizing the risk of Type I and Type II errors. However, the appropriate significance level will depend on the specific research question and the context in which the research is being conducted.
Connection to Confidence Interval
A significance level is directly connected to a one sample t-interval. If we have a significance level of 0.05, we would be looking at a sample statistic that would not occur in our 95% confidence interval. If we select a significance level of 0.02, it matches with a 98% confidence interval. In summation, the complement of our significance level will match with the confidence level of the matching confidence interval. 🌉
Example
In the image below, we see a 95% confidence interval in the non-shaded region for a mean of 0 and 29 df. The shaded region is known as the rejection region. This is the region in which a statistic is significant enough (in accordance with its 𝞪 level) to reject the claimed population mean. In this example, any sample statistic greater than 2.04 or less than -2.04 would lead us to doubt that the true population mean is 0. 🙅
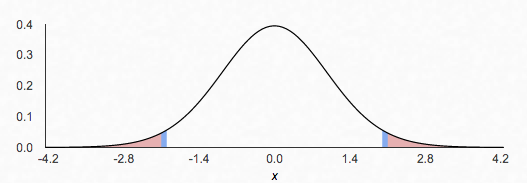
image created with: https://homepage.divms.uiowa.edu/~mbognar/
Writing Hypotheses
Once we have identified our test and significance level, we need to identify and write our hypothesized values. We have two hypotheses: null and alternate.
Null Hypothesis (Ho)
In a one-sample t-test, the null hypothesis is a statement about the population mean, and it is based on the claim made by the previous study or article. The null hypothesis is typically stated as 𝞵 = μ0, where 𝞵 is the sample mean and μ0 is the hypothesized population mean. 🥚
For example, if the previous study claimed that the mean number of chicken nuggets per bag is 20, the null hypothesis for a one-sample t-test would be 𝞵 = 20. This means that the null hypothesis is that the true mean number of chicken nuggets per bag is equal to 20.
Our null hypothesis is always going to be 𝞵 = hypothesized population mean (in number format).
Down the road, the purpose of the one-sample t-test is to determine whether the sample mean is significantly different from the hypothesized population mean. If the p-value is less than the predetermined significance level (usually 0.05), then you can reject the null hypothesis and conclude that the sample mean is significantly different from the hypothesized population mean. If the p-value is greater than the significance level, then you cannot reject the null hypothesis, and you must accept the claim as being true.
Alternate Hypothesis (Ha)
The alternative hypothesis is the opposite of the null hypothesis, and it is what you hope to show is true. In a one-sample t-test, the alternative hypothesis can take one of three forms: 𝞵 ≠ μ0, 𝞵 < μ0, or 𝞵 > μ0, where 𝞵 is the sample mean and μ0 is the hypothesized population mean from the null hypothesis. 🐤
For example, if the null hypothesis is 𝞵 = 20 (the hypothesized population mean is 20), the alternative hypothesis could be 𝞵 ≠ 20 (the sample mean is not equal to 20), 𝞵 < 20 (the sample mean is less than 20), or 𝞵 > 20 (the sample mean is greater than 20).
The alternative hypothesis that you choose will depend on the specific research question and the context in which the research is being conducted. For example, if you are testing the claim that the mean number of chicken nuggets per bag is 20, and you expect the actual mean to be higher, you would choose the alternative hypothesis 𝞵 > 20. On the other hand, if you expect the actual mean to be lower, you would choose the alternative hypothesis 𝞵 < 20.
Example
A recent study has found that the average number of school days missed by a high school senior is 5.2 days. After taking a random sample of 150 high school seniors, our sample has an average of 4.1 days missed with a standard deviation of 0.4. Do the data give convincing evidence that the average number of days missed by a high school senior is less than the claim from the study?
- Ho: 𝞵 = 5.2
- Ha: 𝞵 < 5.2
For this example, our null hypothesis comes directly from the study. The alternative hypothesis comes from the fact that the question implies that we are checking to see if the actual value is less than the hypothesized value.
Checking Conditions
Once we have our test confirmed and our hypothesis developed, we need to check our conditions for inference to be sure that our test can accurately be carried out. Just as with confidence intervals, we have 3 conditions: 🧪
- Random
- Independent
- Normal
Random
If we are planning on using our sample statistics to develop a statistical test, it is imperative that our sample was chosen randomly. This is important because we are planning on using our sample mean to draw inference or conclusions about our population mean. 🍀
If our sample is not chosen randomly to mirror our population, we cannot make statistical claims about the given population.
Independence
Since we are more than likely sampling without replacement, our sample is not truly independent. However, if our sample is not super close to the population, the effect of sampling without replacement is said to be negligible enough that our sample is essentially independent. 🏁
To check that this condition is met, we must verify that it is reasonable to believe that our population is at least 10x that of our sample.
You should state, "It is reasonable to believe that there are ____ (10n) _________ (in context of our population)"
Normal
Since we will be using the normal curve in our next unit to actually calculate the values necessary to perform our test, we need to assure that our sampling distribution is approximately normal. 🔔
There are three options to check this:
- Central Limit Theorem (sample size is at least 30)
- Population is given to be approximately normal.
- Distribution of sample data looks approximately symmetric with no apparent outliers or gaps. This can be shown with a quick, modified box-plot sketch of our sample data.
Checking these conditions in this order will be the least cumbersome attempt in verifying the normal condition. Only one is necessary to verify normality.
🎥 Watch: AP Stats - Inference: Hypothesis Tests for Means
Browse Study Guides By Unit
👆Unit 1 – Exploring One-Variable Data
✌️Unit 2 – Exploring Two-Variable Data
🔎Unit 3 – Collecting Data
🎲Unit 4 – Probability, Random Variables, & Probability Distributions
📊Unit 5 – Sampling Distributions
⚖️Unit 6 – Proportions
😼Unit 7 – Means
✳️Unit 8 – Chi-Squares
📈Unit 9 – Slopes
✏️Frequently Asked Questions
📚Study Tools
🤔Exam Skills
Fiveable
Resources
© 2025 Fiveable Inc. All rights reserved.