5.8 Sketching Graphs of Functions and Their Derivatives
5 min read•june 18, 2024
Kashvi Panjolia
AP Calculus AB/BC ♾️
279 resourcesSee Units
Curve Sketching
Drawing the graphs of functions and their derivatives is very useful in determining key features of the function. From a graph, you can identify discontinuities, find critical points and extrema, and discern many other important elements of a function.
There are seven steps to sketching a graph. This may seem like a lot, but it is important you follow all seven steps to make sure your graphs are detailed and accurate. Let's go through the steps one by one for the function

1. Find the domain of the function.
We can tell that the domain of the function consists of all real numbers because the function is a polynomial. All polynomial functions have a domain consisting of all real numbers, and this is a useful fact to memorize.
2. Determine if there are any discontinuities.
This function is not a rational function that contains a fraction whose denominator could be set to zero, nor is it any function we know of that has a discontinuity. Since there seem to be no points where f(x) is not defined, we can conclude that this function is continuous everywhere in its domain.
3. Find the x- and y-intercepts.
The x-intercepts occur when f(x) = 0, therefore we have to solve the equation (x+2)^2(x-1) = 0. We can solve this equation by setting each factor equal to zero and solving for x.
- (x+2)^2 = 0 => x+2 = 0 => x = -2
- (x-1) = 0 => x = 1
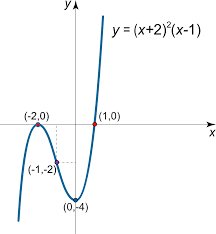
This gives us x = -2 and x = 1 as x-intercepts. The coordinates of these x-intercepts are (-2, 0) and (1, 0).
The y-intercept occurs when x = 0, therefore we have f(0) = (2)^2(-1) = -4. Therefore, the y-intercept is (0, -4).
4. Find the symmetry of the function.
Symmetry is a property of a function that indicates that it has a mirror-like reflectional property. A function is symmetric with respect to a line if, when reflected across that line, the function looks the same as the original function. There are two types of symmetry a function may have:
- Even: The function is symmetrical across the y-axis.
- Odd: The function is symmetric about the origin, meaning that if the function was rotated 180 degrees, it would be a mirror image of itself. An example of a function with odd symmetry is f(x) = x^3.
We can check if a function is even by replacing all the x's in the function with a -x. A function has even symmetry if and only if f(-x) = f(x) for all x in the domain of the function. A function has odd symmetry if and only if f(-x) = -f(x) for all x in the domain of the function.
In our function, neither of these statements hold true, so our function has no symmetry.

The calculus of coffee. Keep going, you're over halfway through the steps! Image courtesy of Redbubble.
5. Find the extrema of the function
In order to find the extrema, we first need to find the critical points of the function. These points occur when the first derivative is equal to zero or is undefined. The first derivative of the function is f'(x) = 2(x+2)(x-1) + (x+2)^2 using the product rule. Setting this equal to zero and solving for x we get x = -2 and x = 0. These are the critical points.
Use the first derivative test to find the local extrema and where the function is increasing or decreasing. To use the first derivative test, we need to test the sign of the first derivative on either side of each critical point. Evaluating the first derivative at x = -3 and x = -1 (values to the left and right of the critical point at x=-2), we see that the first derivative is positive at x=-3 and negative at x=-1. Evaluating the first derivative at x = -1 and x = 1 (values to the left and right of the critical point x=0), we see that the first derivative is negative at x=-1 and positive at x=1. Therefore, the critical point x = -2 is a local maximum and the critical point x = 1 is a local minimum.
6. Find the points of inflection and concavity.
The second derivative of the function is f''(x) = 2(x-1) + 4(x+2) = 2x + 2. If we set this equal to zero and solve for x, we find that x = -1. This point corresponds to a point of inflection. By analyzing the sign of the second derivative, we can see that the function is concave down for x < -1, and concave up for x > -1.
7. Find the asymptotes.
This function is a polynomial, so it does not have a horizontal nor vertical asymptote.
You made it! Now that we have completed all seven steps to find the key features of the original function, we can draw the graph. Try drawing the graph on your own, then look below to check your answer.

Image courtesy of Math24.
You can follow these same seven steps for drawing the graph of the derivative of this function, and the second derivative. While you may not have to draw a graph from scratch on the AP exam, you will likely have to know how to determine the key information about a function from its graph, and drawing the graph can give you an in-depth understanding of these key features. ✍️
Obtaining Information from Graphs of Functions and Their Derivatives
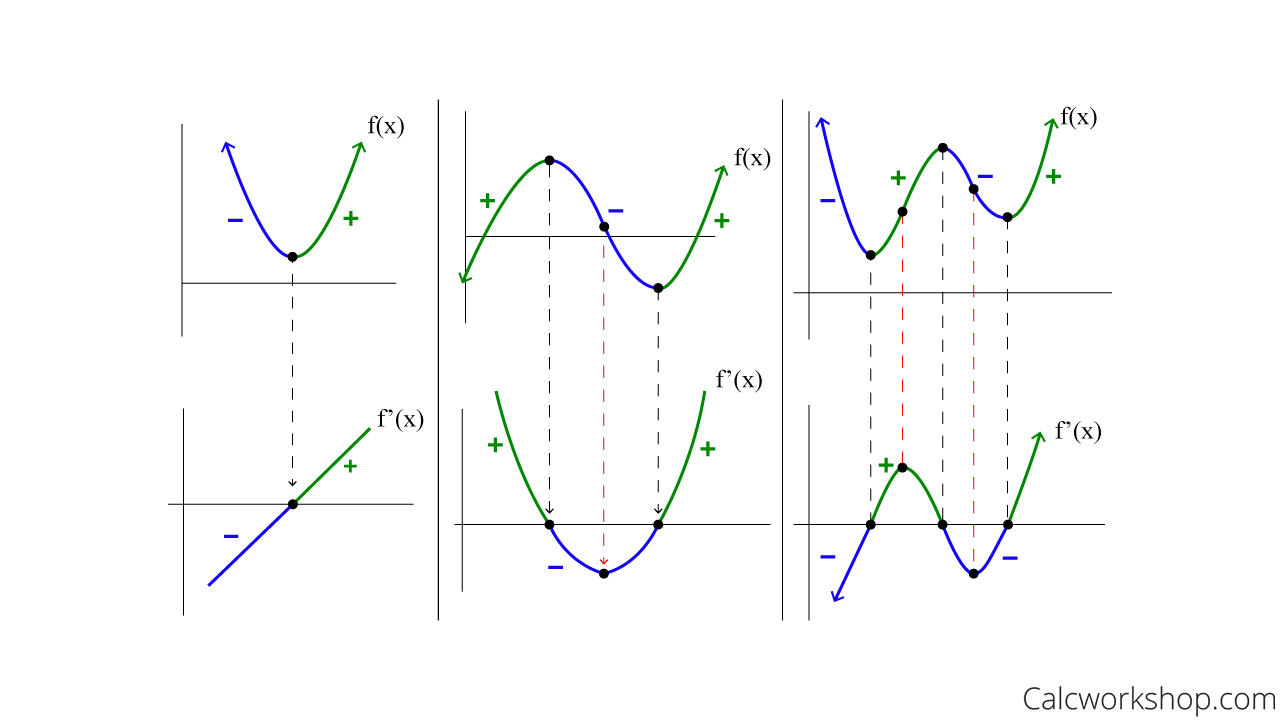
Here are graphs of the originial function and its first derivative for three different functions.

Image courtesy of Calcworkshop.
From the graph of the first derivative, we can tell a lot about the original function. At the point where the first derivative crosses the x-axis and goes from negative to positive in the graph in the bottom left corner, there is a minimum in the original function (the graph in the top left corner). This is in agreement with the first derivative test and what we learned about extrema. 📉
In the middle graph on the bottom row, the first derivative itself has a minimum. We know that at this point, the slope of the second derivative is equal to zero. Therefore, we can conclude that the original function has a point of inflection at this point. To determine whether the function is going from concave up to concave down or vice versa, we can look at the slope of the first derivative (which is the second derivative). The slope of the first derivative is negative before the minimum, and changes to a positive slope after the minimum. From this, we can conclude that the original function is going from concave down to concave up at its inflection point. You can verify this by looking at the graph of the original function in the middle of the top row.
The third set of graphs contains both the concepts of extrema and inflection points. Think about what the first derivative tells you about the graph of the original function as practice. 🤔
Browse Study Guides By Unit
👑Unit 1 – Limits & Continuity
🤓Unit 2 – Fundamentals of Differentiation
🤙🏽Unit 3 – Composite, Implicit, & Inverse Functions
👀Unit 4 – Contextual Applications of Differentiation
✨Unit 5 – Analytical Applications of Differentiation
🔥Unit 6 – Integration & Accumulation of Change
💎Unit 7 – Differential Equations
🐶Unit 8 – Applications of Integration
🦖Unit 9 – Parametric Equations, Polar Coordinates, & Vector-Valued Functions (BC Only)
♾Unit 10 – Infinite Sequences & Series (BC Only)
📚Study Tools
🤔Exam Skills

Fiveable
Resources
© 2025 Fiveable Inc. All rights reserved.