Dalia Savy
A
Anika P
AP Chemistry 🧪
269 resourcesSee Units
Phase changes could be represented in a variety of ways! The following curves might help you understand the relation between phase changes and endothermic/exothermic processes more.
Heating Curves
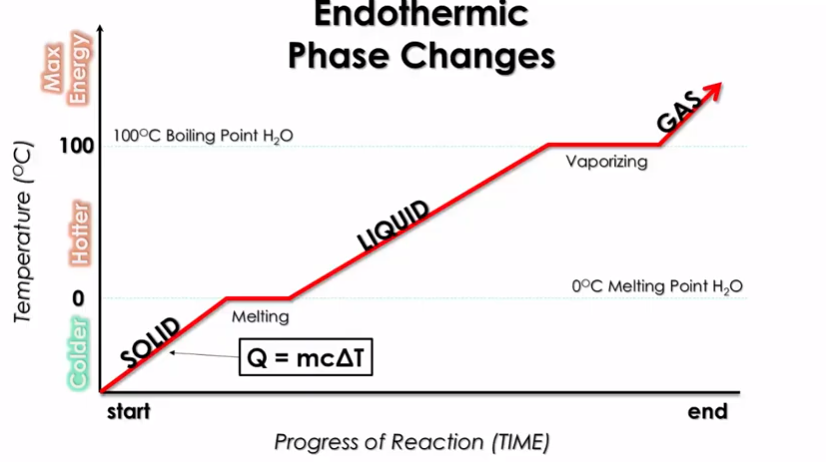
We can more importantly see how transitions between states of matter work energetically through a heating curve:

Image Courtesy of Schoenherr & Diamantopoulos Chemistry Videos
Here, the x-axis is the progress of the reaction, or span of time, and the y-axis is temperature🌡️. We see the transition from solid to liquid to gas as temperature increases. This shows how as you introduce energy into a system, the system goes from a solid to a liquid to a gas.
Wait... What Are Those Plateaus?
It makes sense that temperature increases as you go from solid to liquid to gas, but what are those plateaus marked melting and vaporizing? Well, for a short time while transitioning states, you need to use energy to actually melt or boil the object.
To restate this, you not only need to get up to the proper temperature, but you also must add energy to melt/boil all of it. These are called the heats of fusion (Hf) and heats of vaporization (Hv) going from left to right.
So think about it: a solid melts into a liquid, right? But there is a transition between the two states. The solid stays at 0°C until it is completely melted into a liquid, and then the heating curve progresses.
Vaporizing
The heat of vaporization is almost always higher than the heat of fusion. This makes it takes more energy for something to boil than it takes for it to melt. This is why the vaporizing plateau is longer...it takes more time for the water to fully boil.
Think about this in terms of IMFS. During the melting phase, only some IMFs break. However, when water boils, all of them have to break, which requires more energy⚡.
Potential Question
How many Joules are required to change 30.0g of ice at -20°C to steam at 140°C? There are a few steps you should follow using the following given information:
- The specific heat of ice is 2.108 J/g*°C 🧊
- The specific heat of water is 4.18 J/g*°C 💧
- The specific heat of steam is 2.010 J/g*°C 😤
- Hf for H2O = 334 J/g
- Hv for H2O = 2260 J/g
Steps
There are actually 5 different (quick) calculations you must perform to calculate the answer:
- 🧊Solid - q=mcΔT - (30.0g)(2.108)(20°C) = 1264.8 J
- ΔT was obtained by (-20°C - 0°C). O°C is the melting point of water.
- Melting - Hf(m) - (334 J/g)(30.0g) = 10020 J
- 💧Liquid - q=mcΔT - (30.0g)(4.18)(100°C) = 12540 J
- ΔT is obtained by subtracting the melting point of 0°C from the boiling point of 100°C
- Vaporizing - Hv(m) - (2260 J/g)(30.0g) = 67800 J
- 😤Gas - q=mcΔT - (30.0)(2.010)(40°C) = 2412 J
- ΔT is obtained by subtracting the boiling point of 100°C by the final temperature of 140°C
- Add them all together to get a final answer of 94,036.8 J or 94.0 kJ
Use q=mcΔT at the slopes (since there is a change in temperature) and Hf(m)/Hv(m) on the plateaus
Cooling Curves
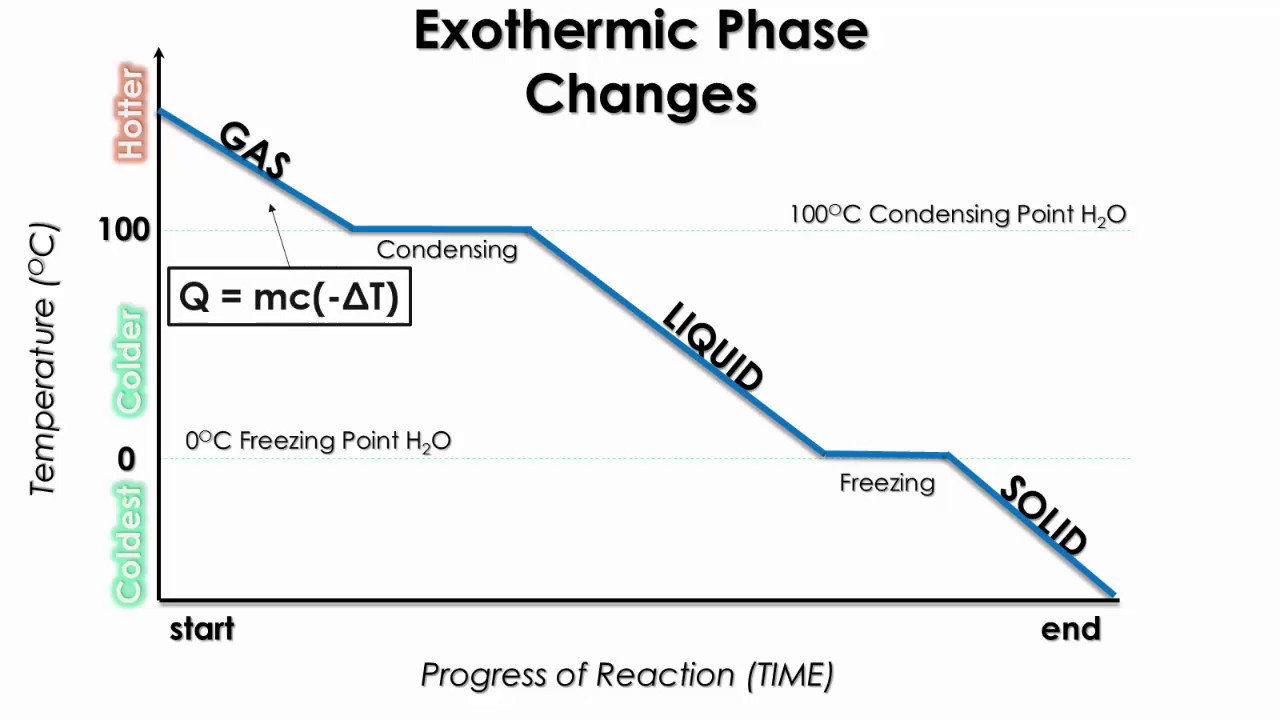
Cooling curves show the exothermic processes, which is the opposite of the endothermic processes the heating curve shows.

Image Courtesy of Schoenherr & Diamantopoulos Chemistry Videos
The cooling curve is the exact same as the heating curve, but it has the heats of condensation and heats of freezing instead. The heats of condensation and freezing are simply the NEGATIVES of the heats of fusion and vaporization.
Pay attention of the units that the College Board gives you. In the heating curve example, Hf and Hv were given in J/g, but they could have easily given you the units J/mol or kJ/g. Make sure you convert as necessary. For example if they gave you the molar heat capacity (with the units J/mol), convert the gram mass into moles for q=mcΔT calculations.
Phase Diagrams
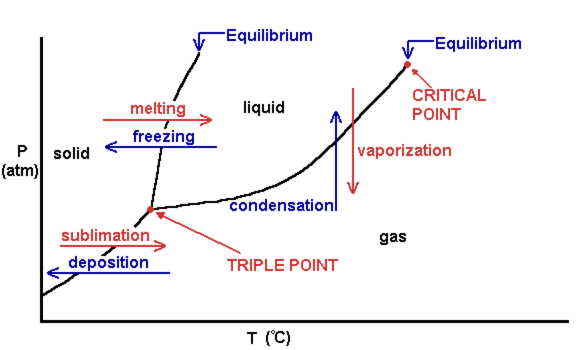
As we know, there are three phases of matter: solid, liquid, and gas. Many of you also may know that you can transition between the three phases through melting, boiling, condensing, or freezing. This can be seen graphically in a phase diagram:

Image Courtesy of Aakash Shah
Let's Break this Down
On the two axes, we have pressure in atmospheres and temperature in Celsius. This shows the relationship between pressure and temperature in determining which state of matter an object is in. As we increase temperature (at a sufficient pressure), we move from solid to liquid to gas, and vice versa.
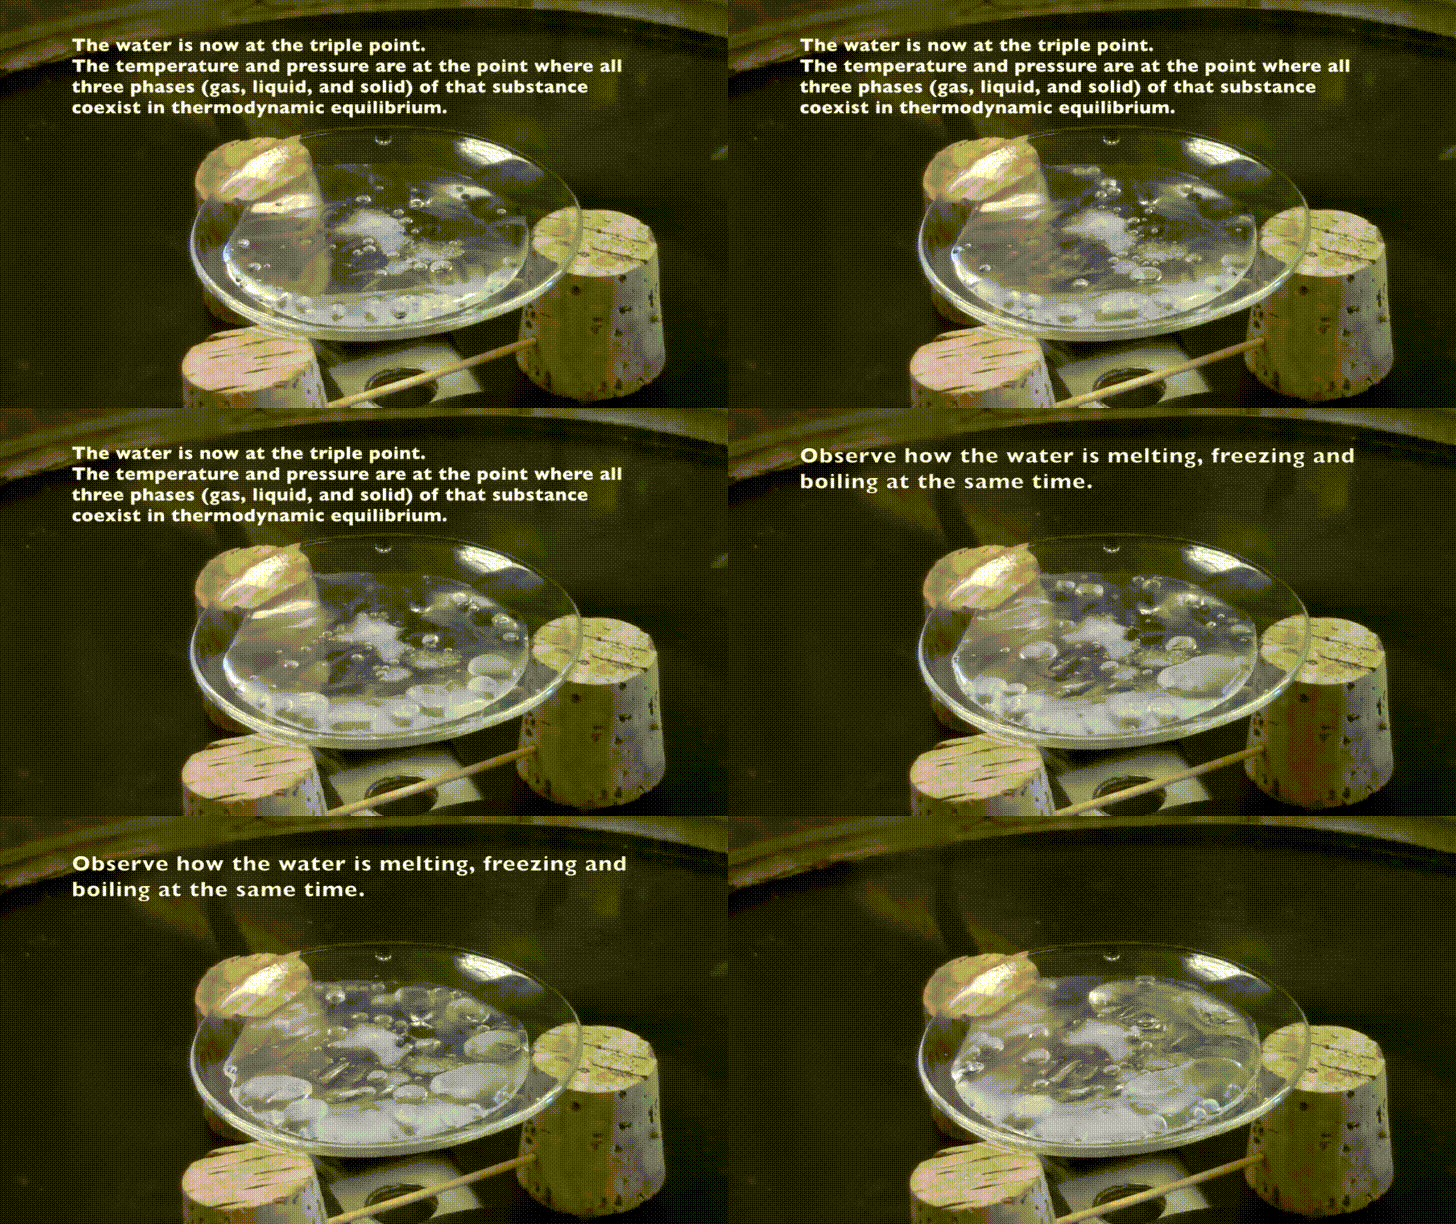
There are two important points on the phase diagram, the triple point and the critical point. The triple point is a weird point where you are in all three states of matter. The critical point is a point at which past this point you can no longer have a liquid, you either have a supercritical fluid or a gas. Here's an animation showing you the triple point of water:

Image Courtesy of UCSC Physics
Practice FRQ
The following practice problem was on a previous AP Exam (from 1995, courtesy of The College Board). This question combines some skills that you have already learned throughout this chapter, especially about heat of formation.
1. Propane, C3H8, is a hydrocarbon that is commonly used as fuel for cooking.
(a) Write a balanced equation for the complete combustion of propane gas, which yield CO2 (g) and H2O (l). **HINT: THINK ABOUT THE STANDARD EQUATION FOR COMBUSTION OF HYDROCARBONS ON THIS QUESTION**
(b) Calculate the volume of air at 30*C and 1.00 atomsphere that is needed to burn completely 10.0 grams of propane. Assume that air is 21.0% O2 by volume.
(c) The heat of combustion of propane is -2,220.1 kJ/mol. Calculate the heat of formation, ∆Hƒ* of propane give that ∆Hƒ* of H2O (l) = -285.3 kJ/mol and ∆Hƒ* of CO2 (g) = -395.3 kJ/mol.
(d) Assuming that all of the heat evolved in burning 30.0 grams of propane is transferred to 8.00 kilograms of water (specific heat of liquid water = 4.18 J/(g*K)), calculate the increase in temperature of water.
Solution!
(A) 1 point: C3H8 + 5 O2 --> 3 CO2 + 4 H2O
(*phases do not need to be listed for full point to be given)
(**if the equation is balanced wrong, no credit is given for part (A) but credit can still be earned if part (B) + (C) are consistent with the incorrectly balanced equation -- use this fact to your advantage on the AP exam and write down any answer even if you are not totally sure while working)
(B) 4 points:
(answer must be consistent with part (A) to receive credit; each line is worth 1 point)

(C) 2 points:

(D) 2 points:

Browse Study Guides By Unit
⚛️Unit 1 – Atomic Structure & Properties
🤓Unit 2 – Molecular & Ionic Bonding
🌀Unit 3 – Intermolecular Forces & Properties
🧪Unit 4 – Chemical Reactions
👟Unit 5 – Kinetics
🔥Unit 6 – Thermodynamics
⚖️Unit 7 – Equilibrium
🍊Unit 8 – Acids & Bases
🔋Unit 9 – Applications of Thermodynamics
🧐Exam Skills
📚Study Tools

Fiveable
Resources
© 2025 Fiveable Inc. All rights reserved.