Karla Jauregui Sandoval
AP Environmental Science ♻️
252 resourcesSee Units
Demographic Transition Model
Diagram Courtesy of Max Roser
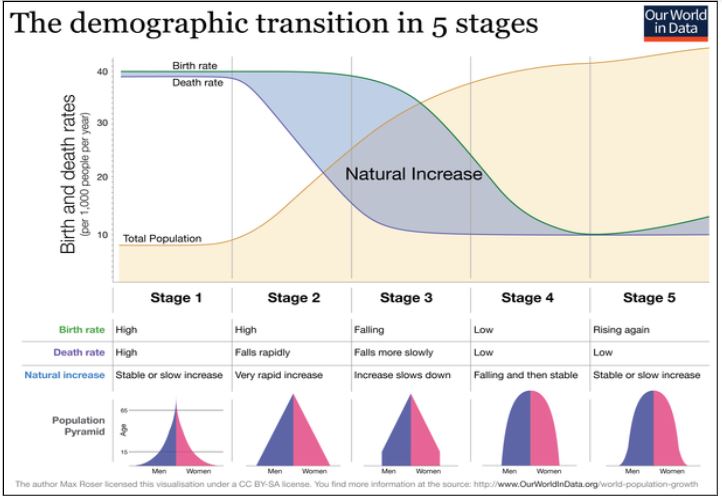
Stage 1 ➪ High CBR, High CDR, low growth rate
Stage 2 ➪ High CBR, lowering CDR, high growth rate
Stage 3 ➪ Lowering CBR, lowering CDR, lowering growth rate
Stage 4 ➪ Low CBR, low CDR, low/negative growth rate
Stage 5 ➪ Rising CBR, low CDR, stable or slowly increasing growth rate
Pre-industrial Stage | Transitional Stage | Industrial Stage | Post-industrial Stage |
Birth rate is high to compensate for high infant mortality rate. Less developed countries are in this stage. Women have many children and unfortunately many do not survive into adulthood. | Industrialization begins. Access to food and improved healthcare lowers death rate. | Death rate drops due to improved medicine and modernization. Mostly developed countries are in this stage. | Birth rate drops to equal zero population growth. If the birth rate falls below death rate, than population will decrease |
Browse Study Guides By Unit
🏜Unit 1 – The Living World: Ecosystems
🐠Unit 2 – The Living World: Biodiversity
👪Unit 3 – Populations
🌏Unit 4 – Earth Systems & Resources
🏖Unit 5 – Land & Water Use
⚡️Unit 6 – Energy Resources & Consumption
💨Unit 7 – Atmospheric Pollution
♻️Unit 8 – Aquatic & Terrestrial Pollution
🔥Unit 9 – Global Change
📚Study Tools
🤔Exam Skills
Fiveable
Resources
© 2025 Fiveable Inc. All rights reserved.