Karla Jauregui Sandoval
AP Environmental Science ♻️
252 resourcesSee Units
Image Courtesy of Pixabay
Survivorship Curves
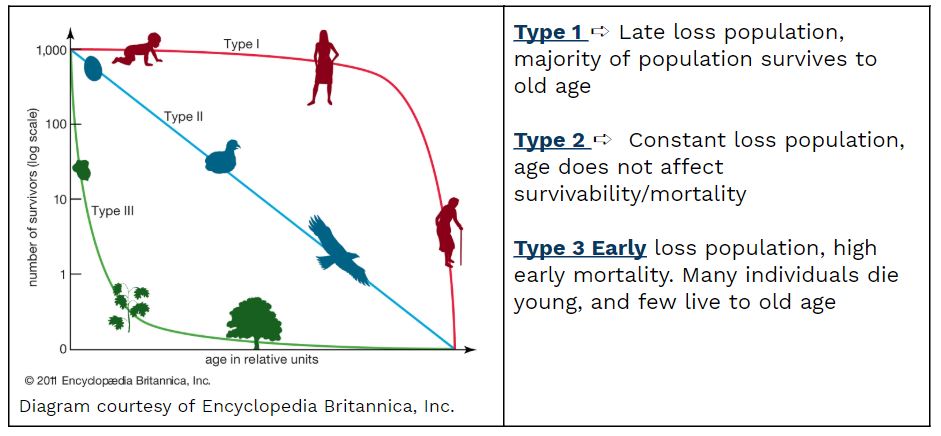
Survivorship curves are used to compare the pattern of mortality between species. These curves show which member of which age groups die at which point. Essentially, it maps the pattern of mortality in a given species based on the way individuals were born and raised. Remember in the last section when we discussed K-selected versus R-selected species? These graphs help put into perspective how a population with a certain parental care rate/reproductive rate may look as individuals continue to age.
Type 1 shows a curve in which most of the population dies off toward their old age. This is representative of a K-selected species; it shows few offspring with high levels of parental care that lived to old age due to this attention to their specific well-being.
Type 2 curve shows a constant loss population that is not affected by age. Age doesn't determine survival or mortality. This curve shows that death is a constant regardless of age.
Type 3 curve shows a species that has an early loss population and few live to old age. This is what the R-selected graph looks like, since many offspring are born yet few survive due to neglect or unindividualized parental attention.
These three graphs are used to determine patterns of certain species and how birth rate or death rate correspond with levels of parental care to predict mortality at a certain age.
Survivability | Type 1 | Type 2 | Type 3 |
Early Age | High | High | High |
Middle Age | High | Medium | Low |
Old Age | Low | Low | Low |
Example | Humans | Song Birds, Bees | Frogs |
K/r | K | K | R |
🎥 Watch: AP Environmental Science Streams
Browse Study Guides By Unit
🏜Unit 1 – The Living World: Ecosystems
🐠Unit 2 – The Living World: Biodiversity
👪Unit 3 – Populations
🌏Unit 4 – Earth Systems & Resources
🏖Unit 5 – Land & Water Use
⚡️Unit 6 – Energy Resources & Consumption
💨Unit 7 – Atmospheric Pollution
♻️Unit 8 – Aquatic & Terrestrial Pollution
🔥Unit 9 – Global Change
📚Study Tools
🤔Exam Skills
Fiveable
Resources
© 2025 Fiveable Inc. All rights reserved.