J
Jeanne Stansak
Haseung Jun
AP Macroeconomics 💶
99 resourcesSee Units
Inflation
Inflation is most certainly the result of increasing the money supply. Think about monetary policies. When the Fed increases the money supply through its open market operations, changing the reserve ratio, and changing the interest rate. This does close the recessionary gap, but it can lead to an inflation. This is the same for deflation. If the money supply decreases, the inflationary gap will be closed, but price level will decrease.
Demand Pull Inflation
Demand-pull inflation is caused by an increase in consumer demand. It happens when AD shifts to the right with consumers spending more. When this happens, the price level increases, but real GDP also increases. This demand-pull is also thought to be caused by too much government deficit spending, because government spending usually drives up AD.
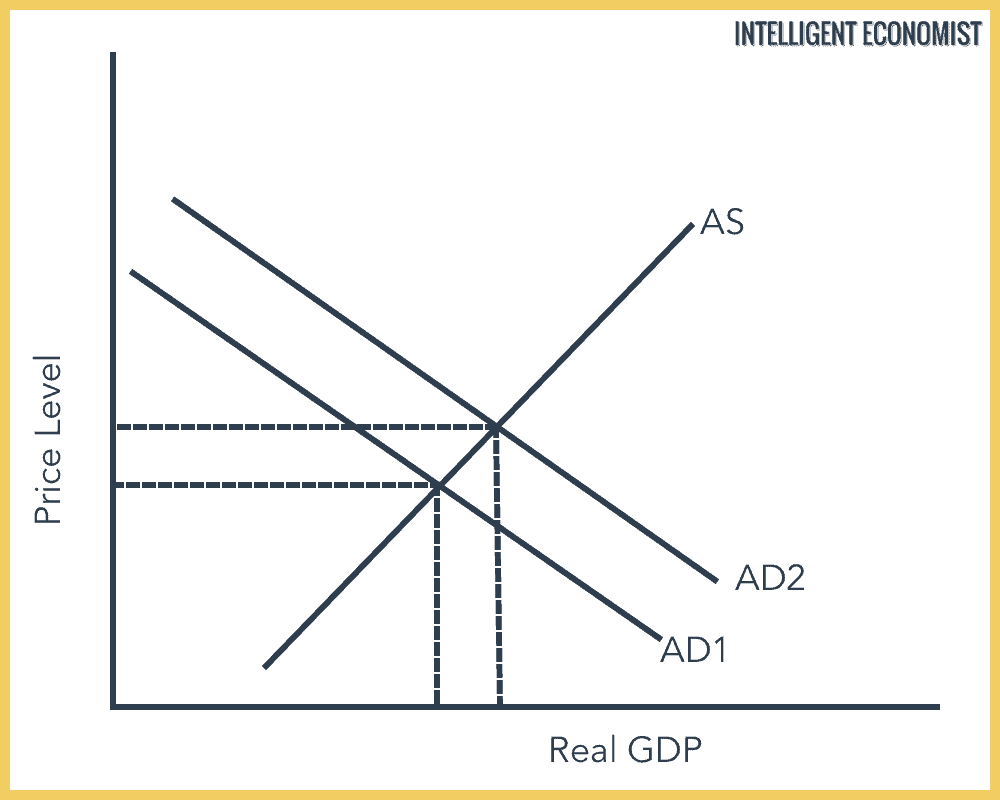
Image Courtesy of Intelligent Economist
Seen in the graph above, AD1 shifts to the right to AD2, increasing both price and real GDP. This is also known as the inflationary gap, and it is corrected through long-run adjustment and contractionary fiscal or monetary policies.
Cost Push Inflation
Cost-push inflation happens when production is decreased (or input costs increased, thus decreasing amount of production). This can be caused by labor or natural resource shortages as well or natural disasters. Anything that disturbs production and decreases supply is though to be cost-push inflation.
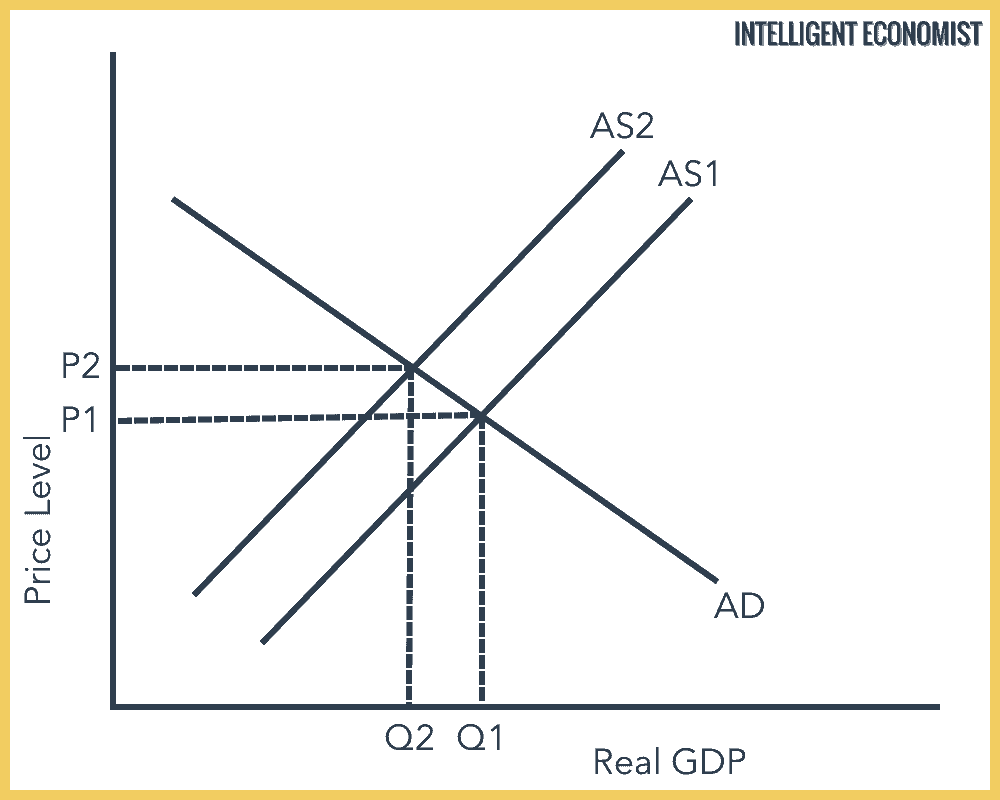
Image Courtesy of Intelligent Economist
With this type of inflation, supply shortages happen, leading to AS1 (short-run in this case) shifting to the left to AS2. This drives price level to increase but real GDP to decrease. This is a bad example of inflation because it's a little harder to fix.
Wage-Price Spiral
This is the worst case scenario. It's just a self-perpetuating spiral where demand rises and supply goes down. Imagine if everyone wants to buy more of everything but the supply of everything keeps going down due to a bad hurricane or earthquake? Basically, in this case, demand-pull and cost-push are working together, which is the worst case with inflation.

Image Courtesy of Wall Street Mojo
Since everything is now at higher prices, it's reasonable that everyone would want higher wages to be able to afford those high costs. This would cause prices to go up even more because it's more expensive to produce now with higher wages. This will lead to more inflation, then higher prices of everything, then higher demand for wages, then higher production costs, then inflation... It just keeps going.
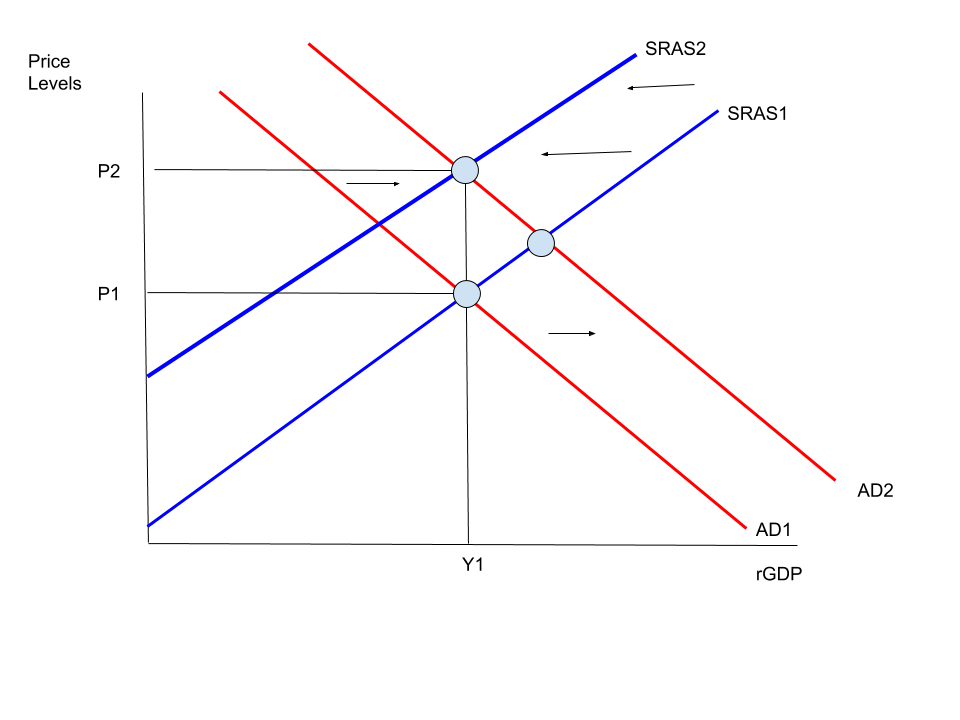
Image Courtesy of Wikimedia Commons
As seen in the graph, we have a double shifter. AD is shifting to the right, while SRAS is shifting to the left. As a result, real GDP is unchanged, but we still have an increase in price level.
Inflation due to Changes in the Money Supply
Inflation can also happen due to the changes in money supply. Remember, the Federal Reserve is in charge of the money supply. So everytime they increase or decrease the money supply, price level can be indirectly affected.

Image Courtesy of Economics Review
MS, meaning money supply, was increase by the Fed. Consequently, the interest rate and quantity of money increased. This indirectly leads to an increase in price, thus inflation.
Theory of Monetary Neutrality
An increase in money supply increase price level almost proportionately, including the price of labor. This will then increase the cost of production, but it will also increase revenue because selling prices are higher. So the firms will not produce more or less, they'll keep it the same way. That's same with the number of employees as well.
This goes to households as well. Households will not buy more stuff. Yes, their wages and salaries have risen, but the price of groceries have also risen too. This means that families won't buy another carton of milk. Instead, they'll buy the same number of eggs as they did before inflation. So what does this all mean?
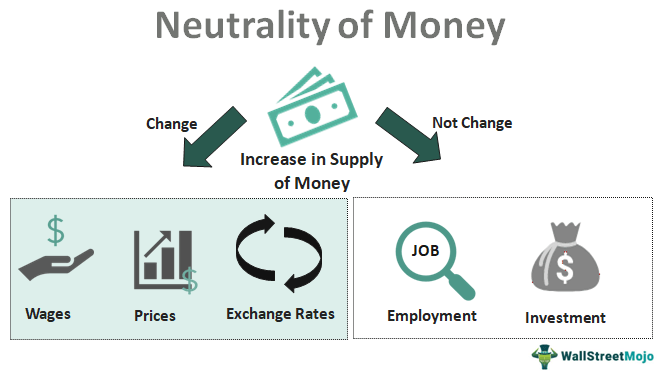
Image Courtesy of Wall Street Mojo
It means that a change in money supply actually has no affect on the economy. Only dollar values are changed, but nothing else. That's the theory of monetary neutrality.
The Theory of Monetary Neutrality is the nice way of saying money doesn't matter
Quantity Theory of Money
The equation for the quantity theory of money is M x V = P x Y.
- M stands for the money supply (usually M1)
- V stands for the velocity of money
- P stands for price
- Y stands for real output (sometimes T), or GDP
So, the quantity theory of money is the money supply times the velocity of money equals the price level times the real output. So at a constant velocity and GDP, an increase in the money supply will lead to a proportional increase in prices. This is known as the quantity theory of money. It's the idea that inflation is proportional to the growth rate of the money supply. If you think about it, it's true when you look at the equation.
Velocity of money is the average times a dollar is spent and re-spent in a specific period of time. It's how fast a (for example) $1 bill moves from one person to the next. If you tend to stash all your cash and never use it, the velocity of money is slow. If you spend it as soon as you receive it, velocity is fast.
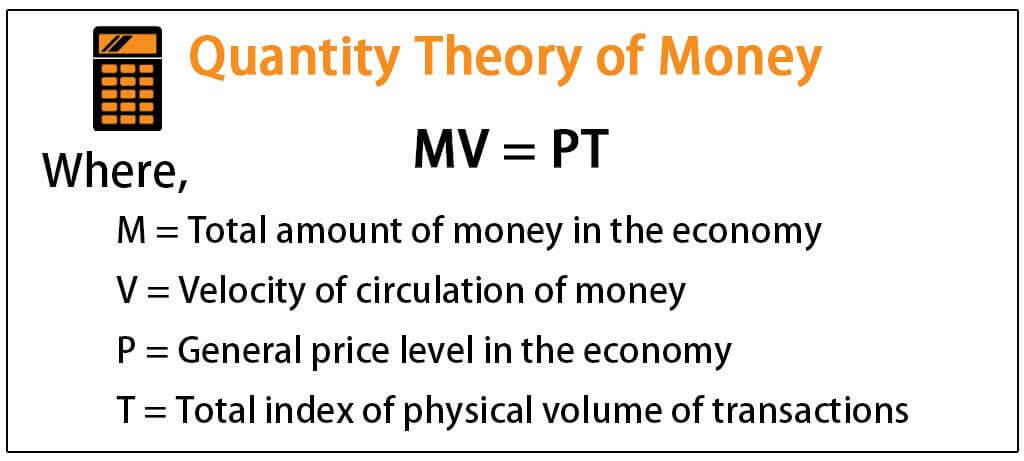
Image Courtesy of Wall Street Mojo
Ex: So let's assume the money supply is $40, and it's used to purchase 10 products with a price of $20 each. Calculate the velocity of money.
$40 x V = $20 x 10
$40V = $200
V = $200/$40
V = 5
Browse Study Guides By Unit
💸Unit 1 – Basic Economic Concepts
📈Unit 2 – Economic Indicators & the Business Cycle
💲Unit 3 – National Income & Price Determination
💰Unit 4 – Financial Sector
⚖️Unit 5 – Long-Run Consequences of Stabilization Policies
🏗Unit 6 – Open Economy - International Trade & Finance
🤔Exam Skills
📚Study Tools
Fiveable
Resources
© 2025 Fiveable Inc. All rights reserved.