1.2 Defining Limits and Using Limit Notation
1 min read•june 18, 2024
AP Calculus AB/BC ♾️
279 resourcesSee Units
Defining Limits and Using Limit Notation
🎥Watch: AP Calculus AB/BC - Graphical Limits
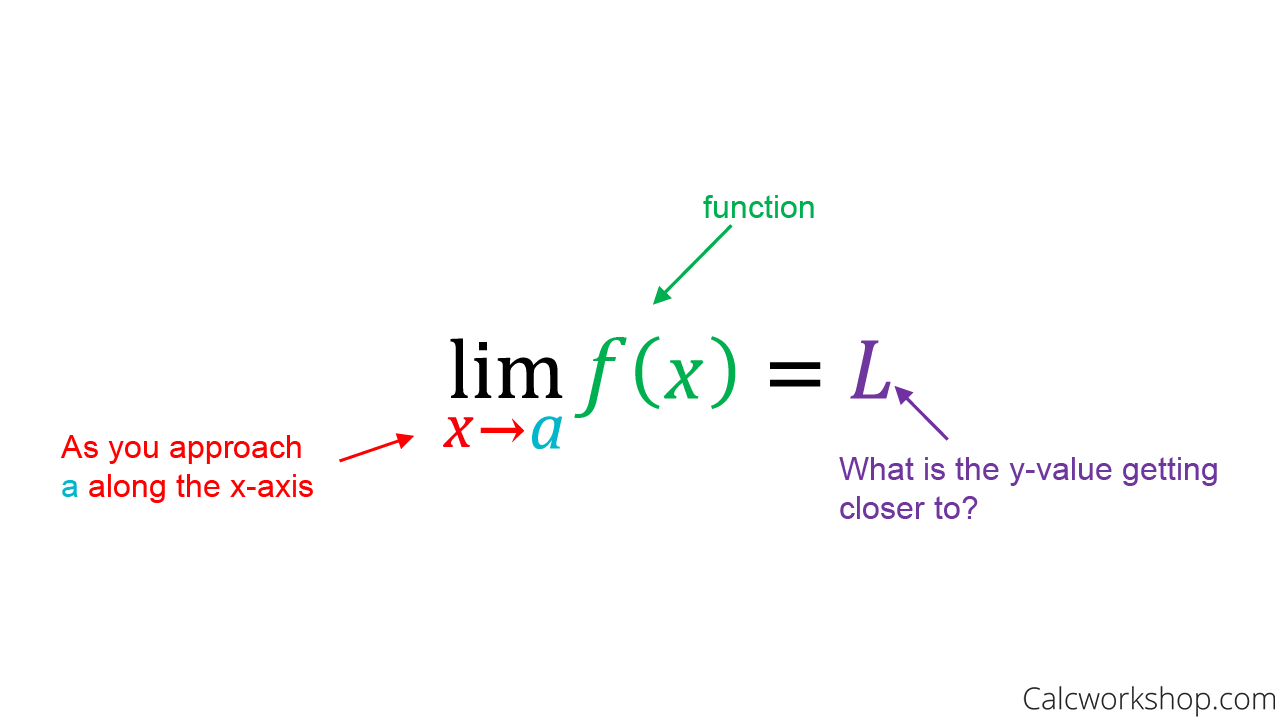
A limit is the y value a function approaches as it approaches a certain x value. You will usually see limits in this notation: 📈

Calcworkshop
This means that as x approaches a, on the graph of f(x), the value on the y-axis that the function approaches is L.
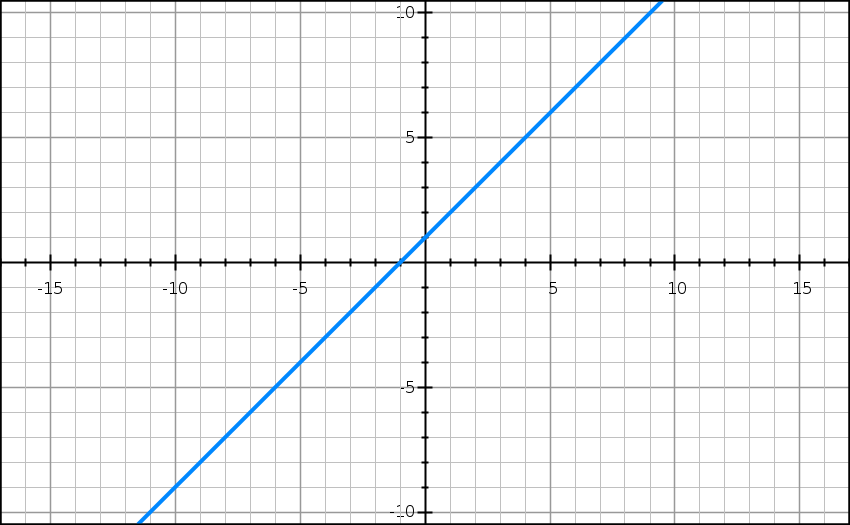
To understand limits better, let’s look at the function f(x) = x + 1. 🖋

GraphSketch
The limit of f(x) as x approaches 4 is the value f(x) approaches as we get closer and closer to x = 4. If we were to graph f(x), this is the y-value we approach when we look at the graph of f(x) and get closer and closer to the point on the graph where x = 4.
Browse Study Guides By Unit
👑Unit 1 – Limits & Continuity
🤓Unit 2 – Fundamentals of Differentiation
🤙🏽Unit 3 – Composite, Implicit, & Inverse Functions
👀Unit 4 – Contextual Applications of Differentiation
✨Unit 5 – Analytical Applications of Differentiation
🔥Unit 6 – Integration & Accumulation of Change
💎Unit 7 – Differential Equations
🐶Unit 8 – Applications of Integration
🦖Unit 9 – Parametric Equations, Polar Coordinates, & Vector-Valued Functions (BC Only)
♾Unit 10 – Infinite Sequences & Series (BC Only)
📚Study Tools
🤔Exam Skills

Fiveable
Resources
© 2025 Fiveable Inc. All rights reserved.