4.10 Introduction to the Binomial Distribution
4 min read•june 18, 2024
Kanya Shah
Jed Quiaoit
AP Statistics 📊
265 resourcesSee Units
A probability distribution is a function that describes the likelihood of different outcomes in a random event. There are two main ways to construct a probability distribution: 🪙
- Using the rules of probability: For example, if you have a coin that you know is fair, you can use the rules of probability to define the probability distribution for the outcomes "heads" and "tails."
- Estimating with a simulation: In this case, you can use a computer program to simulate the random event a large number of times and count the number of times each outcome occurs. From these counts, you can estimate the probability of each outcome occurring. For example, if you want to estimate the probability distribution for the roll of a six-sided die, you can use a computer program to simulate rolling the die a large number of times and count the number of times each number appears.
Both of these methods can be used to construct a probability distribution, and which one is used depends on the specific situation and the information that is available.
Binomial Basics
A binomial random variable (we'll call it X in this study guide) is a type of discrete random variable that is used to model situations where there are a fixed number of independent (outcome 1 doesn't afftect outcome 2, et cetera) trials, each of which can result in either success or failure. The probability of success, denoted by p, is the same for each trial, and the probability of failure is 1 - p. 💥
For example, suppose you flip a coin 10 times, and you want to know the probability of getting exactly 5 heads. In this case, X is a binomial random variable that counts the number of heads in the 10 flips. The probability of success is p = 0.5 (since the coin is fair), and the probability of failure is 1 - p = 0.5.
Situations where these conditions are set are called binomial settings. Here are some more examples of binomial settings:
- Flipping a coin: The number of heads in a sequence of coin flips is a binomial random variable.
- Testing a medical treatment: Suppose you have a new medical treatment that you want to test. You can use a binomial random variable to model the number of patients who experience a positive outcome (success) after receiving the treatment.
- Quality control in manufacturing: Suppose you have a manufacturing process that produces a certain number of defective products. You can use a binomial random variable to model the number of defective products in a batch of items produced by the process.
- Testing a new marketing campaign: Suppose you have a new marketing campaign that you want to test. You can use a binomial random variable to model the number of customers who make a purchase after seeing the campaign.
- Customer satisfaction surveys: Suppose you conduct a customer satisfaction survey and ask customers to rate their satisfaction on a scale of 1 to 5. You can use a binomial random variable to model the number of customers who give a rating of 4 or 5 (successes).
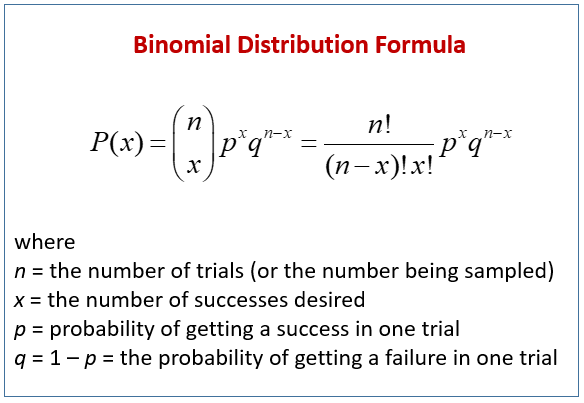
The probability that a binomial random variable, X, has exactly x successes for n independent trials, when the probability of success is p, is called the binomial probability. To find binomial variable probabilities, we can use the formula below or use the calculator function of binomCDF/PDF.

Courtesy of Reddit
BinomialCDF is for cumulative distribution frequency or when you want to include the boundary and every value that came before it. BinomialPDF is for point distribution frequency or when you’re looking for strictly one value.
🎥 Watch: AP Stats - Probability: Random Variables, Binomial/Geometric Distributions
Practice Problem
Suppose you are a marketing manager at a company that sells a new type of snack. You want to know the probability of exactly 3 people out of a sample of 10 people liking the snack. To do this, you conduct a survey and ask each person in the sample whether they like the snack or not. You define "liking the snack" as a success and "not liking the snack" as a failure.
Let X be the random variable that represents the number of people in the sample who like the snack. Since there are two possible outcomes (success or failure) for each person in the sample, and the number of trials (people in the sample) is fixed at 10, X is a binomial random variable with parameters n = 10 and p = 0.5 (assuming that the probability of a person liking the snack is equal to the probability of a person not liking the snack).
What is the probability that exactly 3 people out of a sample of 10 people like the snack? 🍔
Answer
P(X=3) = C(10,3) * (0.5^3) * (0.5^7)
= 120 * (0.5^3) * (0.5^7)
= 0.117
Interpretation in context: This means that the probability of exactly 3 people liking the snack in a sample of 10 people is about 0.117.
Browse Study Guides By Unit
👆Unit 1 – Exploring One-Variable Data
✌️Unit 2 – Exploring Two-Variable Data
🔎Unit 3 – Collecting Data
🎲Unit 4 – Probability, Random Variables, & Probability Distributions
📊Unit 5 – Sampling Distributions
⚖️Unit 6 – Proportions
😼Unit 7 – Means
✳️Unit 8 – Chi-Squares
📈Unit 9 – Slopes
✏️Frequently Asked Questions
📚Study Tools
🤔Exam Skills

Fiveable
Resources
© 2025 Fiveable Inc. All rights reserved.